
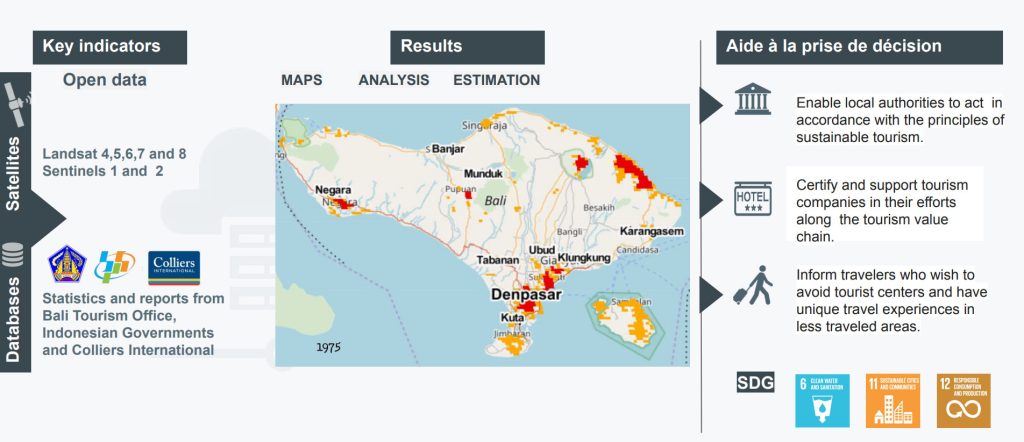
The European Commission’s Joint research center (JRC) has deployed significant effort to map built-up areas across the planet. The result of this effort are an open source, open tools, map layers that are available here. So I thought, perfect, let’s use this to see how the urban areas evolved over Bali over time. The results, shown in the following map, that show the evolution from 1975 to 2015, seem to be inline with the tourism influx shown in the previous map. Yeah, one of the advantages of using satellite imagery is that we can go back in time to do spatial analysis.
The million dollar question now is whether this increase in residential areas is only related to an increase in the number of tourists accommodation areas or whether they are related to normal increase in population. According to the official reports of the Indonesian government (here), the population in Bali has almost doubled in the period from 1971 to 2010, rising from 2.1 Million to 3.8 million persons (circa 1.1% growth rate over the last decade).
While this population growth may help explain the increase in population in the dense urban centers (the red points in the previous map), it does not explain the increase in the low density urban clusters (shown by the green areas on the map). Another indicator is the sheer increase in the number of hotels in Bali over the past decade. Indeed, according to the market analysis report issued by Colliers international (here), the number of hotels, budget and luxury hotels combined, has almost doubled over the period from 2005 to 2015. This seems to be inline with the continuous increase in the number of tourists coming to Bali.
Factually speaking, the earth observation data show that there is a construction pressure, the stats show there is a significant increase in tourist influx and that there might be correlations with the number of hotels as the number of hotels being built-up is in continuous increase. This gives food for thought, first on how available data might be used to indicate certain trends in pressure on available resources.
The objective of these reflexion is not to refrain you from going to your favourite vacation spot, but to think about the possible impact. Maybe one of the solutions would be to avoid touristy centers and stay in a non-traditional places, beside being sure to have unique experiences, you also avoid putting the pressure on resources on critical areas.
A concrete example would be for example to stay at the west or north of Bali where there is less pressure on water consumption rather than staying in the south. You will still be able to visit your favourite spots over a day trip and you will enjoy less crowd and more personalized experiences.