TSDI (Tourism Sustainable Development Index) is a sustainable tourism index developed by Murmuration and based on Earth observation space data and socio-economic data.
TSDI reflects the correlation between the economic development of tourism and its environmental impact. It is inspired by Professor Jason Hickel’s Sustainable Development Index (SDI), which aims to evolve the HDI (Human Development Index) to include environmental impact.
The added value of TSDI is the addition of a tourism dimension. In addition, the SDI assesses developments at a country level, while TSDI obtains a finer measure based on available data extracted from satellite remote sensing data.
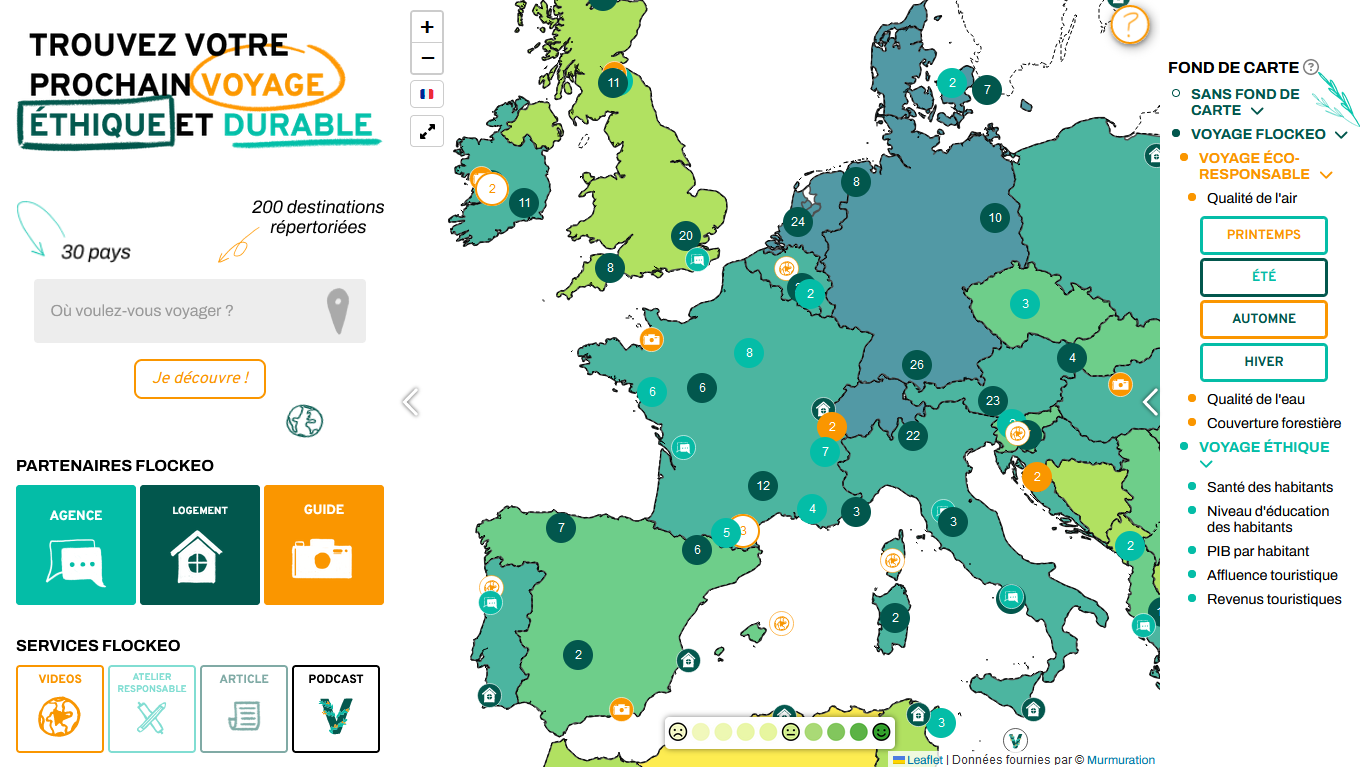
The development of TSDI has led to the creation of a map on the Flockeo website (Flockeo is a platform which aims to develop sustainable tourism). This map provides travelers with scientific information on a country’s sustainability, helping them to choose a vacation destination that respects the 3 pillars of sustainable development.
Sustainable tourism is defined by the World Tourism Organization (UNWTO) as “tourism that takes full account of its current and future economic, social and environmental impacts, addressing the needs of visitors, the industry, the environment and host communities“. It aims to achieve a balance between the three pillars of sustainable development in the production and implementation of tourism activities.
Sustainable tourism is also about the responsibility of individual travelers. They can take action by paying attention to their travel behavior (waste sorting, respect for protected areas, responsible water use, etc.) and their choice of tourism operators or destinations, according to sustainability criteria.
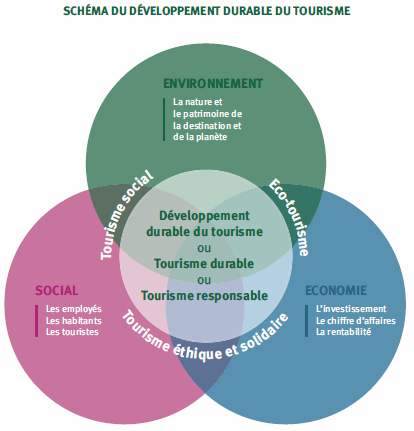
Figure 1 – The three pillars of sustainable tourism (Atout France)
TSDI is calculated by combining two components:
TSDI is mathematically a ratio between these two factors. Human and Tourism Development is the numerator. The higher it is, the higher TSDI. Environmental Risk is placed in the denominator. The higher it is, the lower TSDI. Each component is developed from sub-indicators. TSDI is rated on a scale of 1 to 10
This component is developed from the following sub-indicators:
Health is assessed by comparing the life expectancy of inhabitants with the highest and lowest life expectancy recorded among the countries of the world over the current period. The data comes from INSEE.
The level of education is assessed by comparing each country with the highest level of education in the world. It is based on the average between the number of years spent at school by the adult population (+ 25 years old, sexes combined) and life expectancy at school from kindergarten to higher education. Data supplied by Unesco.
Quality of life is measured by Gross Domestic Product (GDP) per capita. GDP per capita is assessed by comparing each country with the highest and lowest GDP in the world. The data comes from the International Monetary Fund.
This indicator provides information on the volume of tourist arrivals per year (international tourism). The total number of visitors is divided by the country’s population to obtain a number of tourists per inhabitant. Tourist attractriveness is assessed with a threshold of 2 tourists per inhabitant. Data from UNWTO.
This indicator shows the amount of tourism income generated in a country. A threshold is set at 10 billion dollars, beyond which countries that exceed it have the highest possible score and are not further valued. Data supplied by UNWTO.
This component is developed from the following sub-indicators:
Air quality is assessed over the year (previous year of current year). The satellite data used come from CAMS, Global atmospheric composition.
Six contaminants are assessed according to WHO criteria:
WHO criteria set daily limits not to be exceeded in ?g/m3. The effective concentrations of contaminants in the area are averaged over the day and compared with these limits. If all average concentrations respect these limits, then the day studied is counted as a respected day over the period studied. This process is repeated for each day of the study period to establish a score on a scale of 0 to 10. If 90% of the time during the studied period, the contaminants emitted are below the limits, then the risk is considered zero for TSDI. Thanks to satellite data, all countries are evaluated on this indicator.
The Water Resources score is based on an aggregate indicator derived from the work of the World Research Institute (Aqueduct platform). It includes a dozen indicators, such as water stress and flood risk. This risk is converted into a score for TSDI. The total is then converted into a score from 0 to 10. 127 countries are evaluated on this indicator.
This sub-indicator indicates the preservation of forest cover over the last 20 years. A country that has preserved or increased its forest cover over this period will be rated highly. On the other hand, a country that has deforested will receive a low score. The data source is the Modis satellite indicator ” “MOD44B.006 Terra Vegetation Continuous Fields Yearly Global 250m”.
The evolution of the forest between 2003 and 2010 is compared with the evolution between 2011 and 2020. To achieve zero risk, the area’s forest must be preserved. If the forest trend is negative, deforestation is taking place and the environmental risk is increasing. Thanks to satellite data, all countries are assessed on this indicator.
A fourth indicator has been added to compare carbon emissions linked to national consumption (Global Carbon Atlas) with the government directives put in place as part of the Paris Agreement1 (Nationally Determined Contributions).
56 countries2 are evaluated on this sub-indicator. Global Carbon Atlas data estimates carbon emissions generated by a country’s consumption (local production and imports), which is different from territorial emissions (local production and exports). NDCs are studied in the context of net emissions reduction. The difference between these two data provides a score, always evaluated from 0 to 10. A maximum deviation of 12.5% between decisions and actual emissions is tolerated within TSDI.
Countries are eligible for TSDI if they provide UNWTO with up-to-date data on their tourism activity. This is the guarantee that the country has a tourism activity.
A country is eligible for TSDI if it provides sufficient data to calculate the sub-indicators. The absence of data can lead to biased results. At least two indicators are required for each TSDI component. Furthermore, if the education and life expectancy indicators are missing, then the representation of the population is zero and therefore TSDI score is penalized.
In this ranking, the latest available data are used for each indicator.
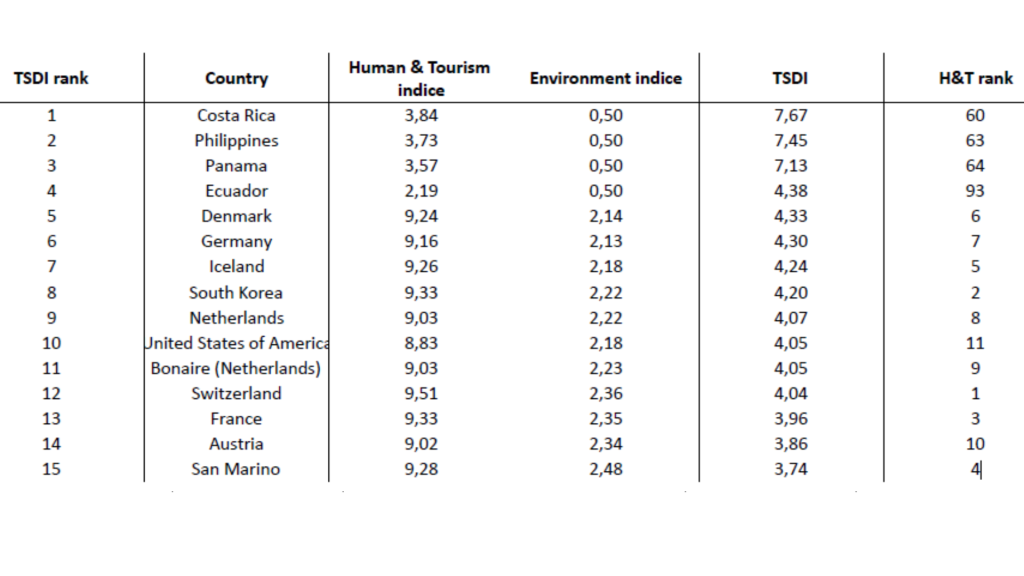

TSDI Ranking – ©Murmuration
The full results table is available for download here. For further details, please contact us at contact@murmuration-sas.com.
TSDI highlights the right balance between human and environmental development. Tourism and/or human pressure have an impact on the environmental score and therefore on TSDI.
The higher the environmental risk, the worse TSDI. The environmental risk can divide TSDI by up to 4. On the contrary, if the environmental risk is low, TSDI will be less impacted, or even valorized. This can be multiplied by two if no environmental risk is detected.
Examples: Costa Rica, the top-ranked country, presents little or no Environmental Risk. It is therefore valued and scores 7/10. To obtain 10/10, Costa Rica could increase its attractiveness to tourists, which would raise its Human Development and Tourism score.
Canada ranks 56th out of 155 in TSDI rankings. This country has been penalized in Human and Tourism Development because of a tourism affluence in 2021 close to 1/10. We can presume that the Covid-19 crisis is partly responsible for these figures. The highest Environmental Risk for this country is in Air Quality, where Canada scores 2.1/10. Ozone is responsible for this low score. This gas is produced in hot weather. It is also produced by vegetation cover (35% of Canada is covered by forests). Ozone formation is thus dependent on meteorological conditions (high solar radiation, high temperatures) and the country’s geography. Canada is therefore penalized in TSDI by ozone, which represents a risk to human health in the event of excessively high concentrations in the air.
TSDI is a sustainable tourism index that evaluates countries according to a scientific method. The sub-indicators are transparent and guarantee a reliable Environmental Risk analysis, while taking into account essential Human Development indicators. TSDI results map is available on the Flockeo website
For further details, please contact us at contact@murmuration-sas.com.
TSDI Map: Flockeo
ATD: Acteurs du Tourisme Durable
Air Quality: CAMS global atmospheric composition forecasts
Water Ressource: Aqueduct Water Risk Atlas
Forest cover: MODIS de Google Earth Engine
CO2 emissions compared with the Paris Agreement’s Nationally Determined Contributions: Global Carbon Atlas, NDC database
Life expectancy: Insee
Education: UNESCO
Gross Domestic Product: IMF
Tourism attractiveness and income: OMT
1The Paris Agreement (2015) is a legally binding international treaty on climate change. Signatory states pledge to hold “the increase in the global average temperature to well below 2°C above pre-industrial levels” and pursue efforts “to limit the temperature increase to 1.5°C above pre-industrial levels.”, https://unfccc.int/process-and-meetings/the-paris-agreement
2The 56 countries evaluated are those aiming to reduce their emissions by 2030.