
Dashboards
Our dashboards are online graphical interfaces, accessible on the Internet from a browser, without the need to install any specific software. These interfaces are interactive. One can play on different parameters to choose the information displayed, identify correlations and sometimes base hypotheses.
Our dashboards
A dashboard displays a large amount of information in a synthetic way by allowing a user to filter and explore the dataset according to his or her needs. By displaying geographical (maps) and temporal (curves and time series) representations, it allows the identification of correlations between different variables.
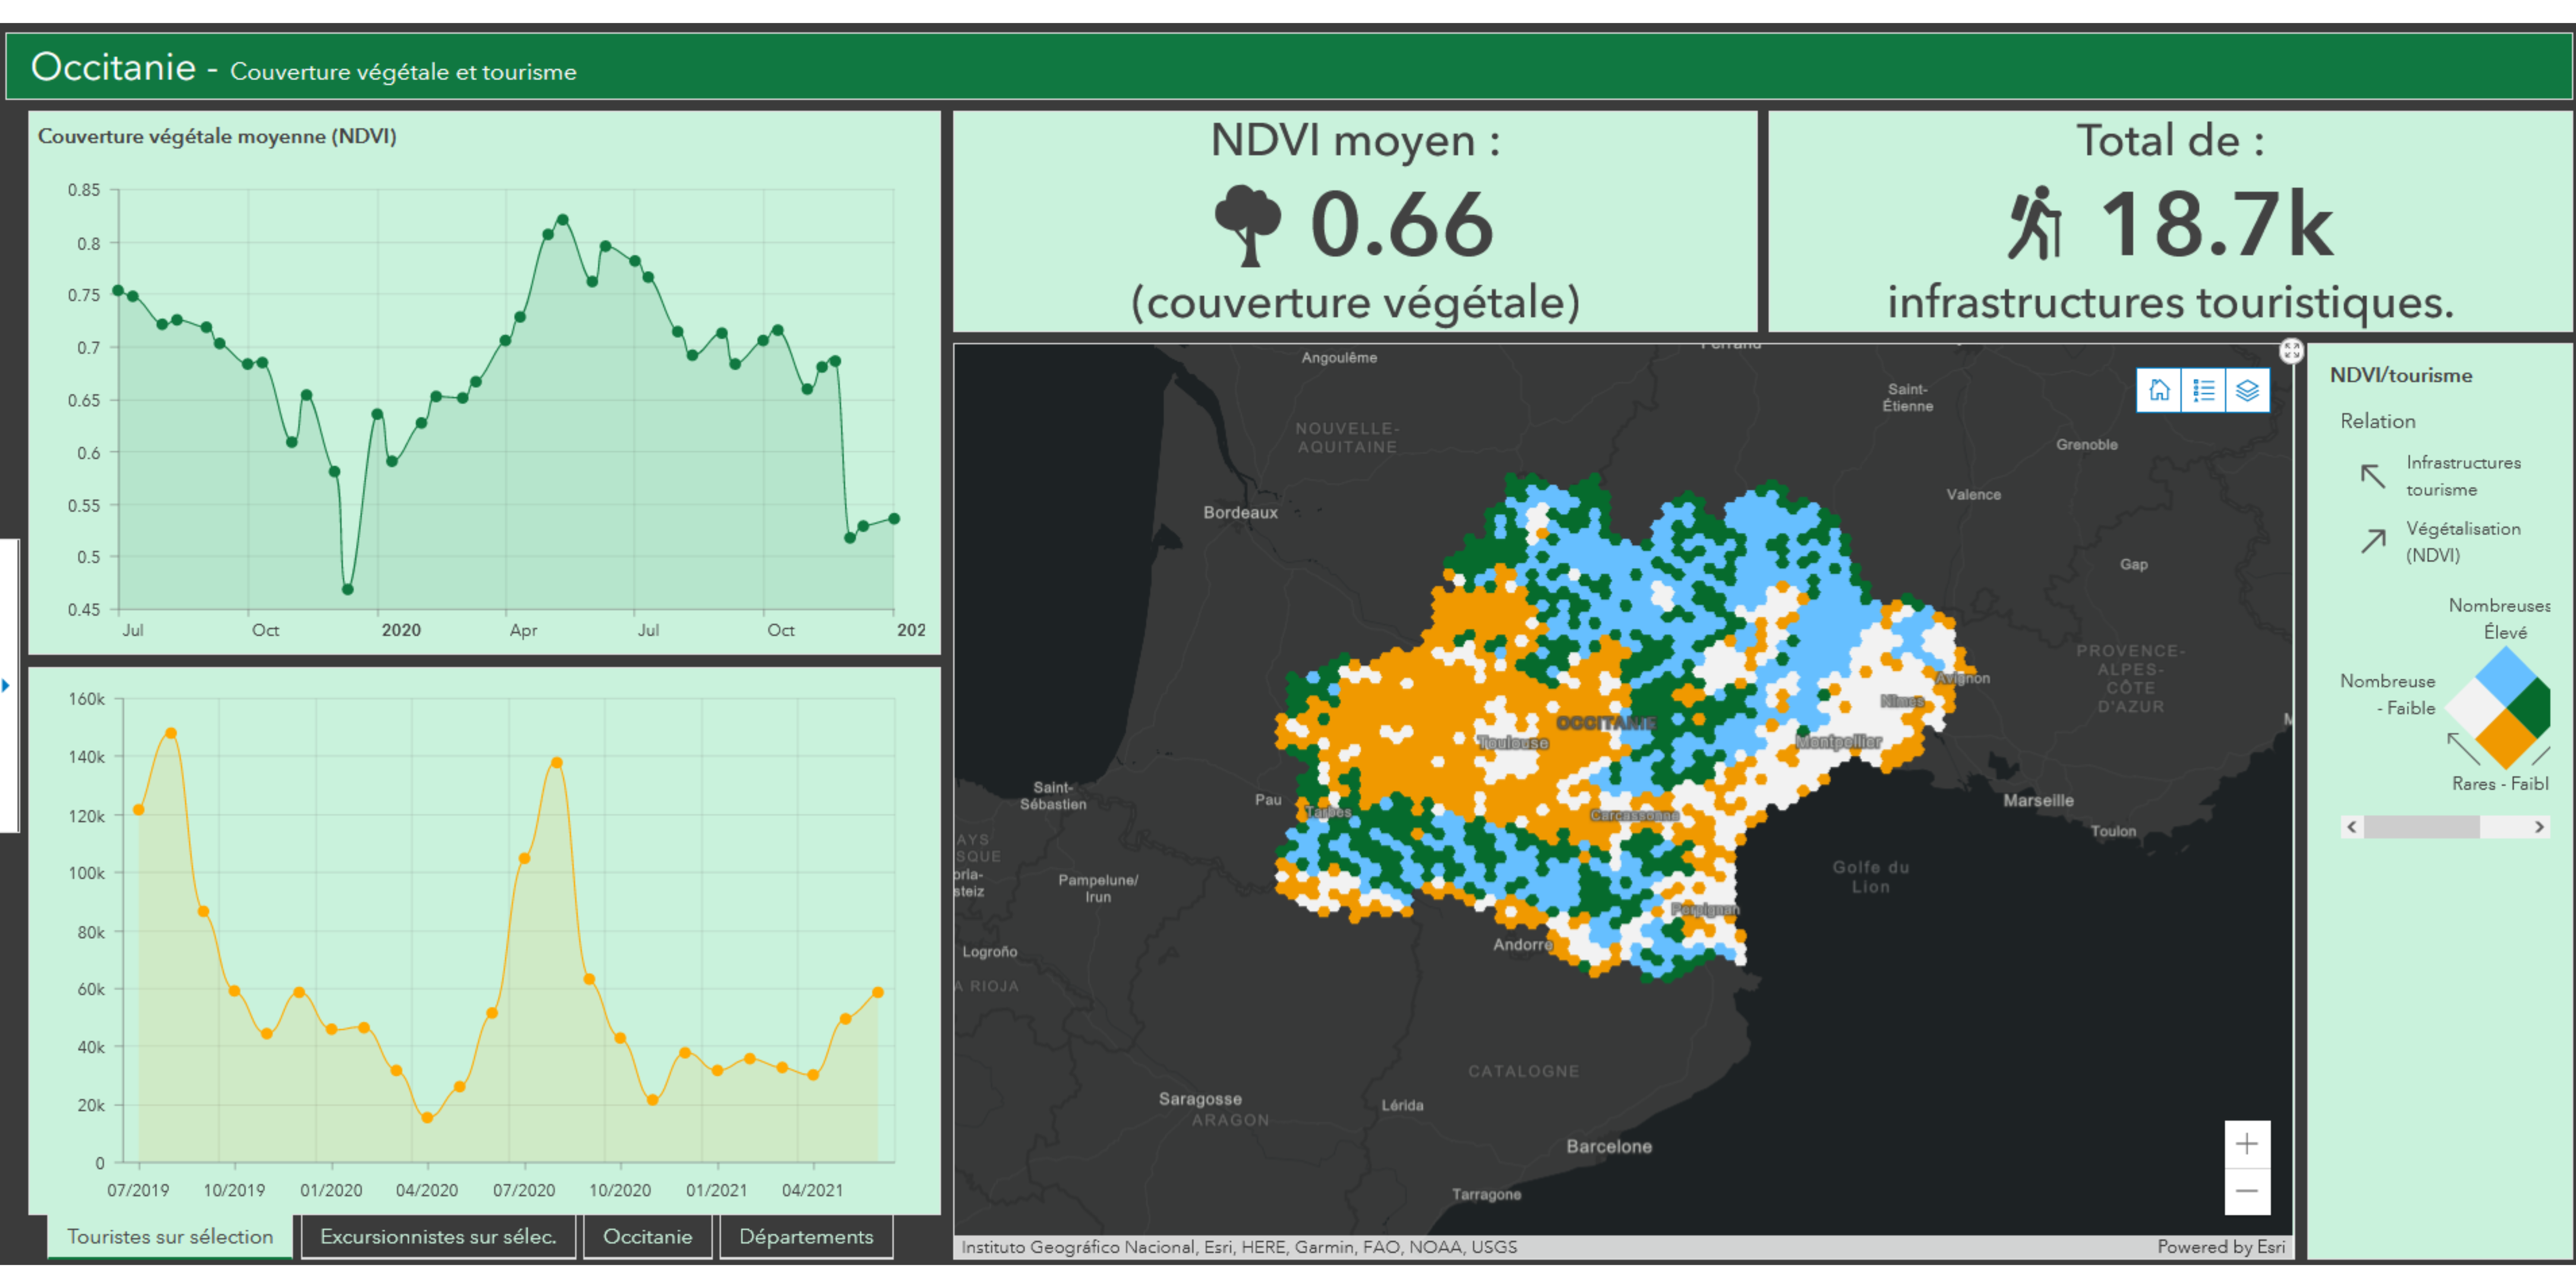
(Example of Murmuration Dashboard, ©Murmuration)
In our dashboards, a particular emphasis is placed on identifying the environmental impact of tourism. To do so, they cross-reference tourism activity data with different environmental variables such as vegetation health, air quality, water quality, or biodiversity status.