A fortnight ago, the World Health Organisation (WHO) published an update of its air quality guideline. This has not happened since 2005. Therefore, this is a major scientific and societal event. The need for air analysis to evolve in line with technological and scientific advances pushed for this intervention. Moreover they demonstrate the highly dangerous and damaging effects of poor air quality on human health.
Indeed, the WHO estimates that air pollution causes 7 million premature deaths. But it also means millions of years of lost life expectancy.
Air pollution is highly dangerous for our health and our planet. This is why the WHO has drastically lowered the air quality thresholds. Because at this level, they reveal the danger of elements present in the air, even in smaller quantities.
This intervention also sounds the alarm. Thus, the international organisation alerts the authorities for the need to act more quickly and effectively against air pollution.
Air quality has a direct impact on human health (UN Sustainable Development Goal 3, Good health and well-being). In addition, it has serious consequences for the environment in general (UN Sustainable Development Goal 15, Life on Earth). Various chemical compounds emitted by human activities alter this air quality.
Particularly noteworthy is fine particle pollution. This is aggravated by various anthropogenic factors (industry, heating, building sector, transport and road traffic). It causes respiratory diseases, cardiovascular problems and complications in infants.
Nitrogen oxide (NOx) pollution covers another dimension of the problem. It leads to acidification of precipitation, which alters soils and waterways, unbalancing many ecosystems. These pollutants are mainly emitted by road traffic. Moreover, they can travel long distances from their place of emission and affect sensitive ecosystems. Consequently, the limitation of these emissions in areas with heavy road traffic (i.e. urban areas) is mainly a health issue. It is not only a local one but also a global one, in order to preserve our common environment.
The thresholds defined by the WHO were lowered between the last version of 2005 and the recent update. This decision is justified by extensive epidemiological research. The results obtained on a large scale in recent years are worrying. They reveal the significant long-term impact of these pollutants, even in small doses. For fine particles, the threshold value has been divided by 2. This translates into a reduction from 10 µg/m3 in 2005 to 5 µg/m3 in 2021. For NO2, the strengthening of the directive is even more important. The threshold has been reduced from 40 µg/m3 in 2005 to 10 µg/m3, thus being divided by 4 today.
Modern Earth observation tools make it possible to monitor the concentration of pollutants in the air from space. This is made possible and accessible by the European Copernicus programme, and in particular the Atmosphere service. From observations collected by the Sentinel 5 satellite, scientists and engineers produce daily data.
These data cover the whole world. They provide an objective, high-level measure (average value aggregated over a 10-kilometre resolution grid) of air quality. They can be used systematically anywhere in the world, and are therefore an invaluable analytical tool.
Comparing, for example, the emissions of several large European cities, we can already see the differences. With the new WHO recommendations, we can see that some cities stand out. Among them, Spanish cities are among the best.
The following graph focuses on the concentration of nitrogen dioxide (NO2) in the air. Here it focuses on 4 European cities over the last 3 years. The cities are Madrid, Bilbao (in red and blue), Athens and Rome (in yellow and green). The orange line represents the WHO recommendation.
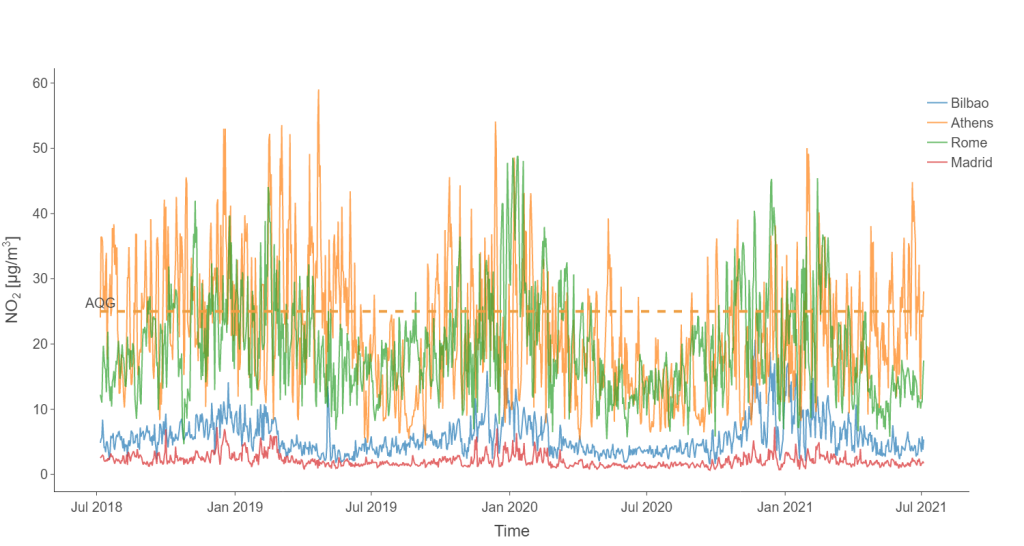
(Graphique des taux de concentration de dioxyde d’azote (NO2) dans l’air, pour les villes de Athènes, Bilbao, Madrid et Rome)
This comparison between southern European cities clearly shows the difference in NO2 pollution. Cities like Rome and Athens are well above the new WHO framework. In contrast, Madrid and Bilbao remain well below.
The situation for fine particles is relatively similar. Indeed, Madrid and Bilbao are both below the WHO thresholds. These observations are illustrated by the graph below (using the same colour code as above).
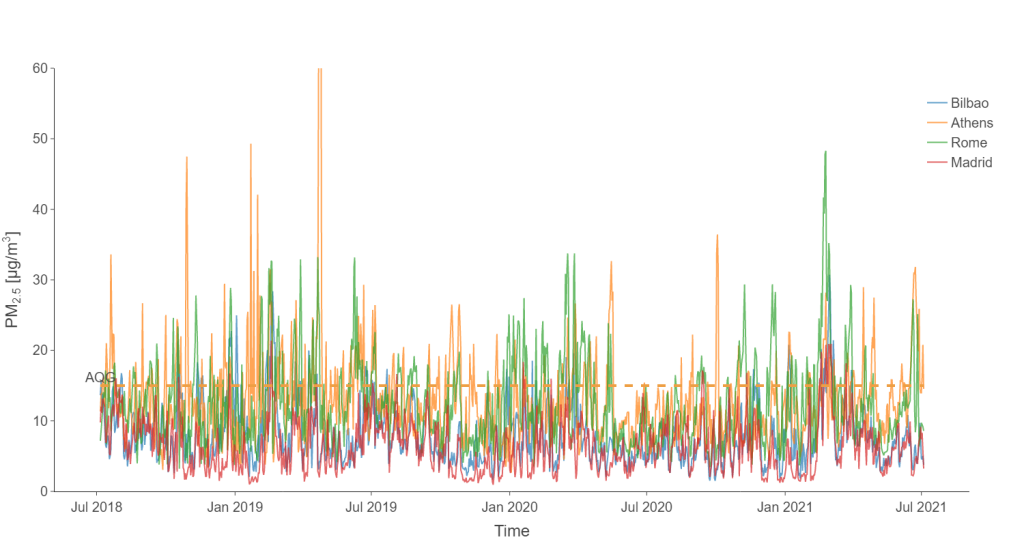
However, over the last 3 years, Madrid and Bilbao have had average levels below the limits set. As for the peaks, they remain much lower than those of the other cities. As a result, air pollution in these Iberian cities is much lower than in Rome or Athens.
So what can explain such a low level of pollution in these Spanish cities? The answer surely lies in the road traffic regulation measures taken by the cities in recent years. Madrid introduced large low-emission zones in the city centre in November 2018. In Bilbao, the speed of vehicles in the city centre has been restricted to 30 km/h since May 2018.
Finally, the data collected on site tends to prove these Spanish cities right. To demonstrate this, in-situ sensors are used. These allow the evolution of nitrogen dioxide pollution to be followed over a long period. The following curve shows the evolution of the nitrogen dioxide pollution index of the World Air Quality Index in Bilbao.
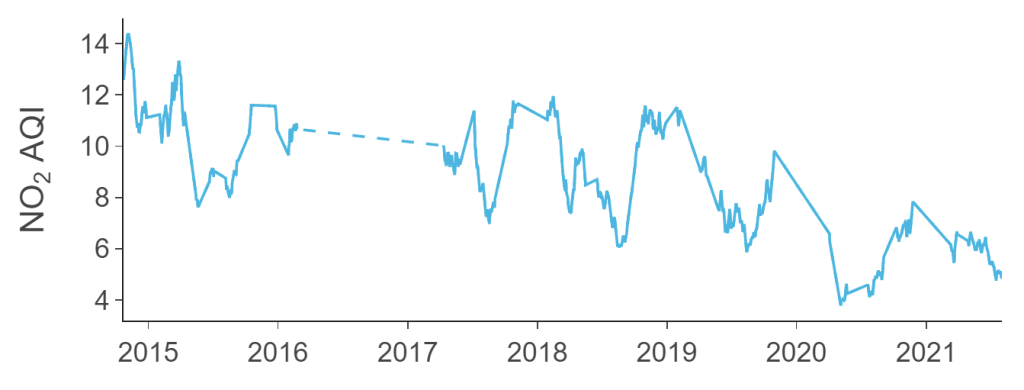
The downward trend is clear in 2020, but should be taken with caution. In this period, the health crisis also had a strong downward impact on emissions.
However, it continues strongly into 2021, which is a very encouraging sign.
Moreover, this could quickly confirm the lasting positive effect of efforts to regulate road traffic in urban areas. There is therefore great hope for the consequences and success of similar measures in other European cities.
Authors : Fabien Castel, Remi Nassiri