Going a few thousand miles and sipping fresh fruit juices in an exotic setting and on a hot, humid afternoon is no longer the preserve of just a few elites. The trip is democratized, it allows a greater openness to the world, to meet the other, change his habits, discover new places, admire the diverse nature around the world. The unparalleled pleasure of facing beautiful landscapes unfortunately and often has a negative impact on the environment. Several initiatives are being implemented at various scales: ecotourism, outdoors, river tourism, bicycle tourism, sustainable tourism.
We wanted to answer the following question: How to understand our impact and help reduce it?
In this case study, we will demonstrate how to quantify its impact in order to implement the necessary measures at the scale of a tourist region : Bali, an Indonesian island famous for its wooded volcanic mountains, rice paddies, beaches and coral reefs.
Speaking at German trade show ITB in Berlin Dr. Stroma Cole, director of Equality in Tourism highlighted that it is the sustainable management of water that will be the major vector of driving tourism in the coming years. She also mentioned that Bali will be facing a critical point at 2020 concerning the water supply and demand. This conclusion is based on the findings of several monitoring organisations, for example the Bali Hotel Association (BHA) and Howarth HTL where they report that the assumed per capita daily use of fresh water is of 183 liters, whereas for a 2 stars hotel the consumption is of 1000 liters. Knowing that lots of hotels are 2+ stars in Bali, the water consumption ratio is likely to be more than 1 to 5. For statistics concerning the number of hotels and their ratings please refer to this document.
We started to look for the available open and free data to see if this makes any sense at all.
The first dataset We looked for was statistics on the number of travellers flying to Bali to see how these fluctuated over the past decade. I found an open dataset (here) coming from the Indonesian government that showed a continuous increase in the number of tourists climbing from 2 millions to approximately 11 million visiting tourists in 2014. Moreover the data showed the number of tourists who checked-in the different attraction over the beautiful island.
The most visited region of Bali in 2014 was the south west region of Tabanan that accounts for about 40% of all tourists.

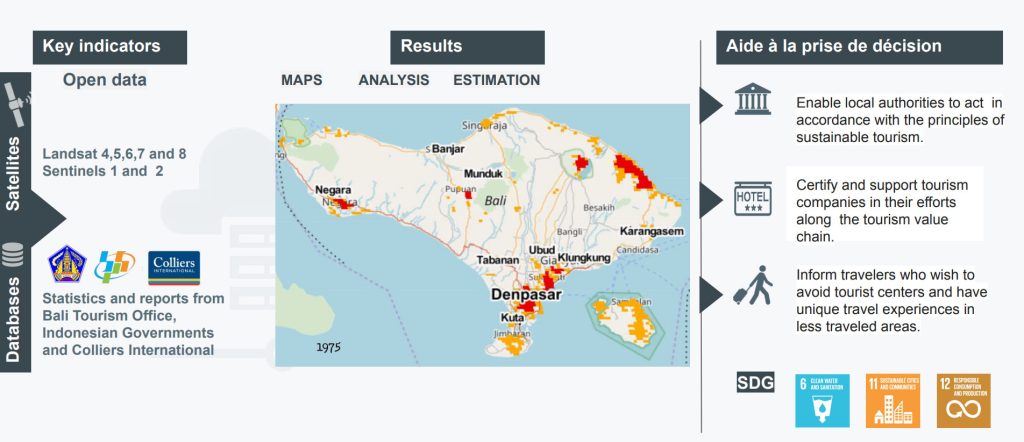
The following map shows the relative weight of each region in the constant growth of tourists.

As you can see, the region that have seen a significant increase in the number of tourists is the region situated at the south and center of the island. The sandy beaches of Kuta, the temple of Tanah Lot are major attractions in Bali. One may think that given the small size of the island, tourists have the choice of staying in the north or the center for example and visit these areas on day tours. This would mean that the increase of residential areas in these regions can be reasonable to avoid putting major stress on the infrastructures through the creation of hotels for example. Trying to identify patterns of growth of residential areas is something that earth observation data by satellites does great thanks to the global coverage and the diversity of sensors.
The European Commission’s Joint research center (JRC) has deployed significant effort to map built-up areas across the planet. The result of this effort are an open source, open tools, map layers that are available here. So I thought, perfect, let’s use this to see how the urban areas evolved over Bali over time. The results, shown in the following map, that show the evolution from 1975 to 2015, seem to be inline with the tourism influx shown in the previous map. Yeah, one of the advantages of using satellite imagery is that we can go back in time to do spatial analysis.
The million dollar question now is whether this increase in residential areas is only related to an increase in the number of tourists accommodation areas or whether they are related to normal increase in population. According to the official reports of the Indonesian government (here), the population in Bali has almost doubled in the period from 1971 to 2010, rising from 2.1 Million to 3.8 million persons (circa 1.1% growth rate over the last decade).
While this population growth may help explain the increase in population in the dense urban centers (the red points in the previous map), it does not explain the increase in the low density urban clusters (shown by the green areas on the map). Another indicator is the sheer increase in the number of hotels in Bali over the past decade. Indeed, according to the market analysis report issued by Colliers international (here), the number of hotels, budget and luxury hotels combined, has almost doubled over the period from 2005 to 2015. This seems to be inline with the continuous increase in the number of tourists coming to Bali.
Factually speaking, the earth observation data show that there is a construction pressure, the stats show there is a significant increase in tourist influx and that there might be correlations with the number of hotels as the number of hotels being built-up is in continuous increase. This gives food for thought, first on how available data might be used to indicate certain trends in pressure on available resources.
The objective of these reflexion is not to refrain you from going to your favourite vacation spot, but to think about the possible impact. Maybe one of the solutions would be to avoid touristy centers and stay in a non-traditional places, beside being sure to have unique experiences, you also avoid putting the pressure on resources on critical areas.
A concrete example would be for example to stay at the west or north of Bali where there is less pressure on water consumption rather than staying in the south. You will still be able to visit your favourite spots over a day trip and you will enjoy less crowd and more personalized experiences.