Big cities keep on growing, it is important to monitor this development process, and that’s why Murmuration created its own Urbanisation Indicator. As a result of technological progress, humanity is constantly expanding its urban territory. This phenomenon of urbanization leads to an artificialization of the soil and poses three major problems:
Nowadays, three solutions exist to answer these problems :
Murmuration proposes an Urbanization indicator, built from satellite data. Today, a city or a village is quite capable of determining the evolution of its urbanization without using spatial data. However, it is at a more global scale that the task becomes more complex. Indeed, for a region or a country to be able to calculate the evolution of its urbanization, it would be necessary for all the sub-communities to gather their data together.
The Urbanization indicator is an observation tool that allows the visualization of land artificialisation in a given area of the world at a given time. It also allows to study its evolution between two years. To better understand how it works, here are two images.
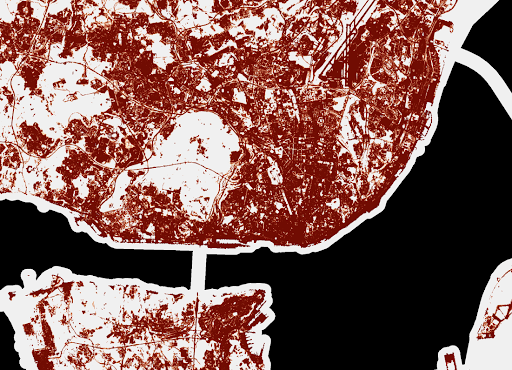
(Urbanism map of Lisbon, 2018, ©Murmuration)
This is an image representing the density of land taking process in Lisbon in 2018.The accuracy is 10 meters. The density is calculated as a percentage. The darker the area is red, the higher the density of land taking process. Conversely, the lower the density of an area, the more it will be represented in light red, until it becomes white if the area is not artificialized.
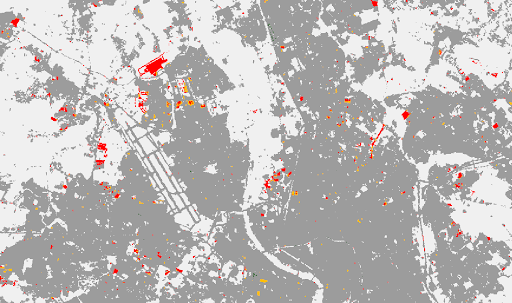
(Evolution of land artificialisation in Toulouse between 2015 and 2018, ©Murmuration)
Finally, this image represents the evolution of land artificialisation of a part of the city of Toulouse between 2015 and 2018. The accuracy is 20 meters. the areas in dark gray t have not evolved between the two periods. In red and yellow, are the areas where we built. In green, these are the areas where the artificialization has decreased (creation of park, destruction of building, …). Finally, in white, these are the undeveloped areas.
To operate, the indicator uses three different databases. The first is from the Wekeo service. This company offers Copernicus data for free download, including all Sentinel satellite data, contributing missions and Copernicus marine, terrestrial, atmospheric and climate services. We can find the data of soil impermeability in Europe with a precision varying between 10 and 100 meters depending on the selected options. These data are present every 3 years, from 2006 to 2018 and are accompanied by data showing their evolution over the same period.
However, this service only offers soil impermeability data in Europe. This is why we use a second database from the Copernicus Global Land Service. This organization offers data displaying the built-up areas in the world, from 2015 to 2019, with a precision of 100 meters. We can then calculate ourselves the evolution of these areas between each year.
Finally, for the most recent years and for a worldwide observation, the database from the World Cover service is used. WorldCover provides a new reference product for global land cover at 10m resolution for 2020, based on Sentinel-1 and 2 data that have been developed and validated in near real time and at the same time maximize the impact and usability for end users.
To better understand the usefulness of such an indicator, let’s see how we can study the evolution of urbanization in Occitania in relation to the objective “Net Zero Artificialization” (NZA).
This objective in France aims at limiting the increase of the impermeability of the soils in order to reach a zero growth in 2050. Thanks to the urbanization indicator, we can see that the Occitanie region has experienced a growth of 3.4% between 2015 and 2018.
Even though such growth seems to show that the ZAN goal is not met, it should be understood that the region is one of the most attractive in the metropolis, with a population growth of 3.5% between 2013 and 2018 according to INSEE.
In order to evaluate the achievements of the Net Zero Artificialisation’s objectives, Urbanisation Indicator seems to be the most adequate. It allows a larger time and space analysis.
On the other hand, it can be seen that urban growth is difficult to compensate. When a natural area is artificialized, there is little chance that it will return to its original state.
Indeed, between 2012 and 2018 only 0.01% of the artificialized territory in Occitania has undergone a significant decrease in its imperviousness.
Finally, it is interesting to study the impact of major cities on the increase in net land artificialisation in Occitania between 2015 and 2018. Toulouse, which is the region’s capital, alone absorbs 8.2% of all urban growth while constituting only 4.87% of the urban area in Occitanie.
Montpellier, which is the second largest city in the region, absorbs 3.2% of all urban growth, while it only constitutes 2% of the urban area in the region. One might therefore think that the metropolises act as catalysts for soil artificialisation.
However, these are the same cities that have the highest density in the region and therefore limit urban expansion to a maximum. The large cities therefore have a double-edged impact on land artificialisation.
Thus, it is important that the city councils of these metropolises continue to develop their urbanization while applying the three methods for limiting the net artificialisation of land: avoid, limit and compensate.