The quality of air around the world is deteriorating, it is a well-known fact, and still too few people acknowledge it as the need of the hour. This article explains how Murmuration contributes in helping to combat this issue. Murmuration is a French SME created in March 2019 with the aim of introducing the environmental dimension into the decision-making cycle, focusing on tourism management institutions and stakeholders. We are using mainly earth observation satellite data, mixed with in-situ and socio-economic data.
Murmuration has developed ready-to-use indicators based on the prior mentioned data sources. Among them, the air quality indicator aims to provide insights on the evolution of major air pollutants across the globe for comparison and evaluation purposes. The indicator follows standards for data production and dissemination, such as the Open Geospatial Consortium (OGC) standards. It makes it ready to use for most of the client applications. The main objective is to help policymakers and other stakeholders identify problems at their root so that actions can be made accordingly.
The quality of air has been deteriorating since the beginning of the industrial revolution. Toxicity of the air is higher than ever before. In order to control it, it has to be monitored systematically. To do so, the World Health Organization started to establish Air Quality guidelines in 1987 to define safe levels of the air pollutants. The latest revision published in September 2021 defines six compounds as the primary air pollutants because of their significant effect on human health. It includes 4 gases (NO2, SO2, CO and O3) and 2 dust particles (PM2.5 and PM10). Each of these compounds affect human health in several different ways.
Through its air quality indicator, Murmuration aims at helping even non-experts understand the situation. The indicator studies air pollution at the level of individual compounds as well as an aggregated score including all pollutants.
The nature of the indicator and the algorithms used are explained in the following sections. The data used for computing the indicator comes from the TROPOMI instrument of the Sentinel 5P satellite.
But why using satellite data when air pollution has been monitored using ground sensors for a long time? The conventionally existing measurements based on in-situ sensors are very local to the region of measurement (say 50 m). This cannot be used to monitor the whole city unless these in-situ sensors are installed in every place in the city. But, it is a very costly process and has to be maintained consistently.
This is the place where satellite data comes to play. Even though there is a tradeoff with the spatial resolution, the data helps studying the air quality at the city level. Satellites monitor air quality at a much cheaper cost, in a scalable way (once launched and flying, it can monitor many cities with no additional cost) and are producing measurements that can be compared from one city to another making it a very good tool for evaluating and benchmarking cities with each other.
Sentinel 5P is the first sentinel satellite to monitor the atmospheric composition. The instrument measures solar light in the ultraviolet and visible, near-infrared and shortwave infrared spectral bands. The light is split into different wavelengths using a grating spectrometer and they are captured accordingly by four different detectors to measure the level of different compounds.
The raw data from Sentinel 5P is then processed, validated, georeferenced and made available for ease of access through Copernicus Atmosphere Monitoring Service (CAMS). The processed and validated data for all of the 6 above mentioned compounds are used to calculate the indicator. The 6 individual compounds are available every day at an hourly level. Daily levels are then computed with aggregation algorithms reflecting the health impact (short term or long-term ) of each pollutant (based on WHO guidelines). The aggregated data is then fed over a data transformation pipeline to be converted to the desired format.
The aggregated air quality indices are calculated at 2 different temporal levels – yearly and daily. Two different algorithms are used to arrive at the indices :
The indexes are defined at two different coverages – European and Global. This is the result of availability of raw data of Global coverage at 0.1 ° (appx. 100 km near the equator) spatial resolution and raw data of European coverage at 0.01 ° (appx. 10 km near the equator) spatial resolution. The raw data for European coverage are readily available as mass concentration in µg/m3 which is the standard used by WHO to evaluate air quality levels. On the contrary, the raw data for global coverage is not readily available in the standard format.
In the global coverage data, dust particles such as PM10 and PM2.5 are available as mass concentrations in kg/m3 which can be converted using a conversion factor. But the gases like NO2, SO2, CO and O3 are available in mass mixing ratio in kg kg-1. They have to be converted to mass concentrations using ideal gas equations. Finally, all the gases and dusts are available in mass concentrations with the same unit µg/m3.
At the end, Murmuration’s Air Quality Indicator can be used from 2 channels that Murmuration is providing:
While the map service takes care of studying the distribution of various compounds and its hotspots, the programmatic interface helps in narrowing the study to any particular area of interest and to study the change over a temporal scale.
The indicator helps in identifying problems such as pointing out regions or times of high pollution or temporal range of high pollution exposure. The World Health Organization estimates that air pollution causes 7 million premature deaths per year. This is one of the biggest environmental threats to human life. By finding out regions of concern, appropriate actions and measures can be taken by government bodies, enterprises and non-governmental organizations to mitigate the situation.
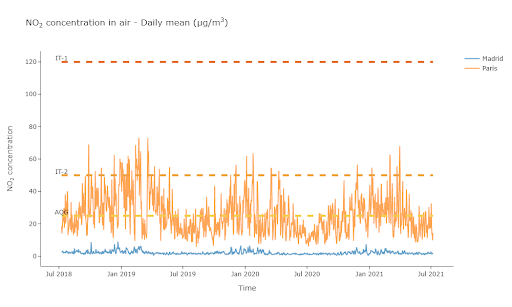
(Graph of NO2 concentration in the air in Paris and Madrid, ©Murmuration)
The above chart shows the Murmuration NO2 indicator and its evolution in Madrid and Paris over a three-year time frame.
Thanks to the indicator developed by Murmuration, it is possible to study the air quality level at the city level in a cost-effective manner. Monitoring air quality using satellite measurements will not completely replace the in-situ measurements. They act complementary to each other. While satellite measurements help in monitoring air quality at city level or higher, in-situ measurements help in monitoring air quality at street or neighborhood level (hospitals, schools, parks etc.).
This article is one among many that will be published until the end of March, explaining what Murmuration’s indicators are and their purposes.
Author : Murugesh MANTHIRAMOORTHI, Remi NASSIRI