The IUCN (International Union for Conservation of Nature) stated that “plastic pollution is the most widespread problem affecting the marine environment”. Most of this pollution ends in the plastic oceans.
Plastics take centuries to degrade and contaminate the entire food chain. Each year, up to 13 million tons of plastic end up in the oceans because it is not recycled. Current estimates indicate that there is about 150 million tons of plastic found in the ocean. In 2018, the UN environment program placed the issue of plastic in the ocean among the six environmental emergencies of greatest concern.
Active methods of plastic removal are required to address this issue. Being able to detect and track plastic litters is crucial to enable these methods. There are three main approaches to track them: numerical modelling, in situ observation and earth observation satellite images.
Most of ocean plastic comes from rivers. Knowing the main points of origin and using data on ocean currents and on vertical mixing of water layers, it is possible to model the probable trajectory of plastic litter and the areas where they will stagnate and concentrate. The Copernicus Marine Service provides ocean current models that are used for this purpose.
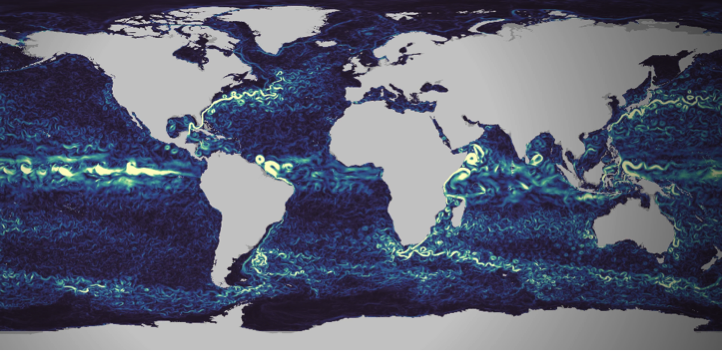
Figure 1 : Visualization of Copernicus Marine currents numerical models, extracted from https://myoceanlearn.marine.copernicus.eu/
Local measurements are regularly performed to understand and quantify the issue’s importance. With statistical processing of the collected data, these measurements campaigns allow to build and calibrate the plastic litter tracking models (see for instance van Sebille et al.).
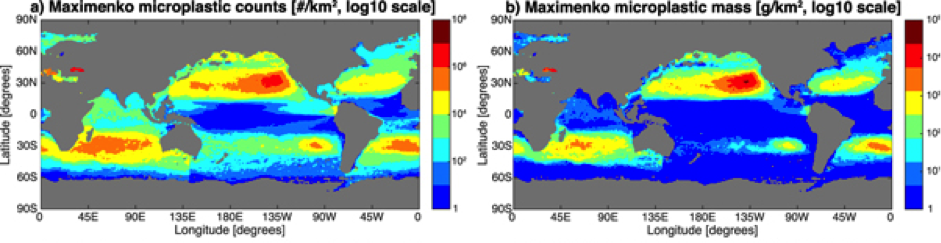
Figure 2 : Maps of microplastic count (left column) and mass (right column) distribution for one of the studied statistical models, extracted from the work of Van Sebille et al.
99% of ocean plastic lays at the bottom of oceans, whereas only 1% floats on the surface. Remote sensing from space therefore suffers from a structural limitation that will never make it a self-sufficient solution to the problem. However, with their ability to cover large et inaccessible areas, using satellite images is an innovative approach that can complement modelling and in-situ observation. While still at the research and development stage, many research groups carry out experiments. They have to work with the tools at their disposal, which are not initially designed for this task.
The European Earth Observation Copernicus program offers different options here. First is the satellite Sentinel 3, dedicated to ocean observation. It is though designed to monitor large-scale oceanic processes. Its 300 meters resolution does not make it an adequate tool for plastic monitoring.
The Sentinel-2 satellite is an interesting alternative. It provides images in the visible part of the spectrum with a 10 to 20 meters resolution. Small pieces of plastic are not noticeable. However when they aggregate into large clusters they become more likely to be detected by satellites with such spatial resolution.
Sentinel-2 has been studied as a solution to ocean plastic monitoring by many research groups (see the work performed by a group from 25 different institutions, or this work carried out by a group from the Plymouth Marine Lab in 2019). However It has been initially designed for land monitoring. While its orbit covers all the earth, images are not collected on the wide open ocean areas. Images are only available on continental coastal areas and around islands. It is still though a very interested approach showing interested results in the covered areas.
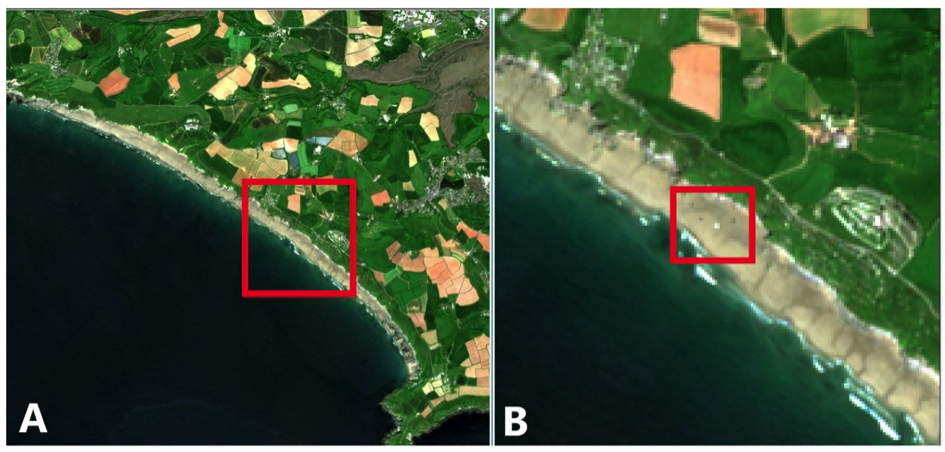
Figure 3 :Example of plastic detection on a coastal are using Sentinel-2 images. Extracted from the work of the Plymouth Marine Laboratory
Earth observation satellite programmes mainly focus on land. Coverage of the oceans is limited to the observation of global phenomena, with a relatively low resolution (~300m).
Higher resolution observations are available over coastal areas.
However, most plastic waste is deposited on the ocean floor. It is therefore not observable by satellites. Those that remain on the surface can accumulate in clusters visible from space.
Observation from space should be considered as a complementary solution. It can be used to detect plastic waste in coastal areas before it is dumped.
Earth observation is thus a useful data source for flow analysis and waste tracking models. It provides a wide and systematic spatial coverage that ideally complements the more accurate but local and punctual in-situ observations.
Finally, it is important not to stop thinking about the role of space observation in ocean pollution control. Indeed, satellites are evolving, and so are observation tools. Improved resolution could allow for more detailed observation of plastic waste in the oceans. Going from 300 m resolution to 20 m with global coverage of the oceans would be a major advance. This would make it possible to position space observation at the centre of the tools and means for sustainable action in the oceans.
Setting up this type of mission takes time, but the plastic crisis in the oceans could lead space observation down this path.
Authors : Fabien Castel, Rémi Nassiri
Copyright image ImaginEarth
MURMURATION SAS is currently working on the FLOCKEO web platform to offer travelers and travel professionals a map of the world to know the environmental impact on destinations.

The FLOCKEO barometer uses 3 essential indicators that combined satellite data with other data to evaluate the ecological footprint on tourist destinations.
The International Union for the Conservation of Nature (IUCN) is one of the world’s leading organizations dedicated to the protection and preservation of nature. The FLOCKEO barometer takes into account data from protection programs at international, national and / or regional level and also the quality controls to ensure their effectiveness.
Satellite data combined with other data sources can be used to estimate the risks related to water. The FLOCKEO barometer takes into account the quantity, the quality, as well as the existence and the relevance of the infrastructures for a better management of water around the world.
The indicator makes it possible to specify low density areas as well as very dense urban areas by combining several data, including satellite data. The FLOCKEO barometer thus guides travelers to more or less dense urban areas and creates their own “green” journey.
D-3 before the official release of the FLOCKEO website
Global warming, pollution, degradation of cultural sites, deforestation … the effects of overtourism on the environment and populations can be dramatic.

MURMURATION is one of the start-ups that has joined the acceleration program of Climate-Kic France . This program is intended for all start-up companies that are motivated and committed to solving the problems related to climate change. Thanks to Flockeo, we want to implement an inclusive approach!
Over-tourism, over-crowding of sites and the under-frequenting of other sites which, however, have put in place the necessary infrastructures are critical for travel professionals who see their “working tool” deteriorate or, conversely, little known. MURMURATION has developed a solution that combines environmental studies and a web platform, Flockeo, in order to provide reliable indicators to manage a tourist destination, to make it known and to make visible the daily work of the traveling professionals who commit themselves.
Some places are not suitable to receive too many travelers. In Venice, for example every year millions of visitors for some tens of thousands of Venetians who live there. Unesco has also listed the city on the list of World Heritage in Danger. This was also the case for the city of Dubrovznik in Croatia last summer.
For example, the need for water to fill pools in hotels and fossil fuels, for example to cool in countries where resources are very limited, can create major problems. The countries of the Mediterranean are the most exposed because most of them favor mass tourism without implementing the necessary infrastructures.
The most infamous example is the Maya Bay beach from the movie “The Beach” with Leonardo Di Caprio. This beach was closed by the Thai authorities until 2021 to allow the coral reefs to reform and thus prevent the erosion of the bay. The damage to the natural ecosystem of this bay is such that the beach had to be closed to motorboats and tourists.
The growth of tourism by 2050 will double energy consumption and greenhouse gas emissions. The carbon footprint of tourism is generated by transport but also by the need to produce all that tourists need on their vacation spot. The two tourist cities, Jakarta and Denpasar, in Bali are among the most polluted cities in the world.
Climate change affects all regions of the world. Polar ice caps are melting and ocean levels are rising. In some regions, extreme weather events and precipitation are becoming more frequent, while others are facing increasingly extreme heat waves and droughts. Floods are the most expensive natural disasters in the world. The cost of flood damage amounts to billions of euros. Also, the human losses are dramatic.
#1 Sierra Leone : more than 500 dead and 810 missing as a result of a landslide caused in 2017 by intense rains.
#2 United States : 42 victims after hurricane Harvey and 30,000 displaced people.
#3 Niger: 44 victims during the monsoons of 2017 and more than 70,000 victims.
#4 China: The 2017 floods were responsible for 228 deaths and 3.5 million displaced people across the country.
#5 Sri Lanka : 300 deaths from a dengue epidemic, whose floods have spurred proliferation.
#6 Central Africa : Persistent drought, consecutive cyclones and floods have completely devastated crops in this region, which is highly dependent on rainfed agriculture and smallholder farmers. Nine countries in the region will be most affected by the climate crisis in the coming years: Malawi, Mozambique, the Democratic Republic of Congo (DRC), Tanzania, Zambia and Zimbabwe.
#7 Floods in Venice : For the past few days, St. Mark’s Basilica has been weakened by a historic high tide! Water has flooded the cafe terraces and has even flooded the hotels. the tourists had to return to their hotels, sometimes even passing through the windows.