In metropolitan France, forests cover 31% of the territory, i.e. nearly 17 million hectares. The importance of vegetation cover as a lung for the animal kingdom is well known. But all over the world, these green treasures must meet the ecological and social challenges of tomorrow. In particular, to address climate change, strategies must be put in place for the sustainable management of forest ecosystems and the maintenance of forest health.
In February 2021, in France, a petition was launched to stop the cutting of trees in the forests of the Sénart region. The movement is gaining momentum, and the NOF (National Office of Forests) must explain the management of vegetated areas and their sustainability
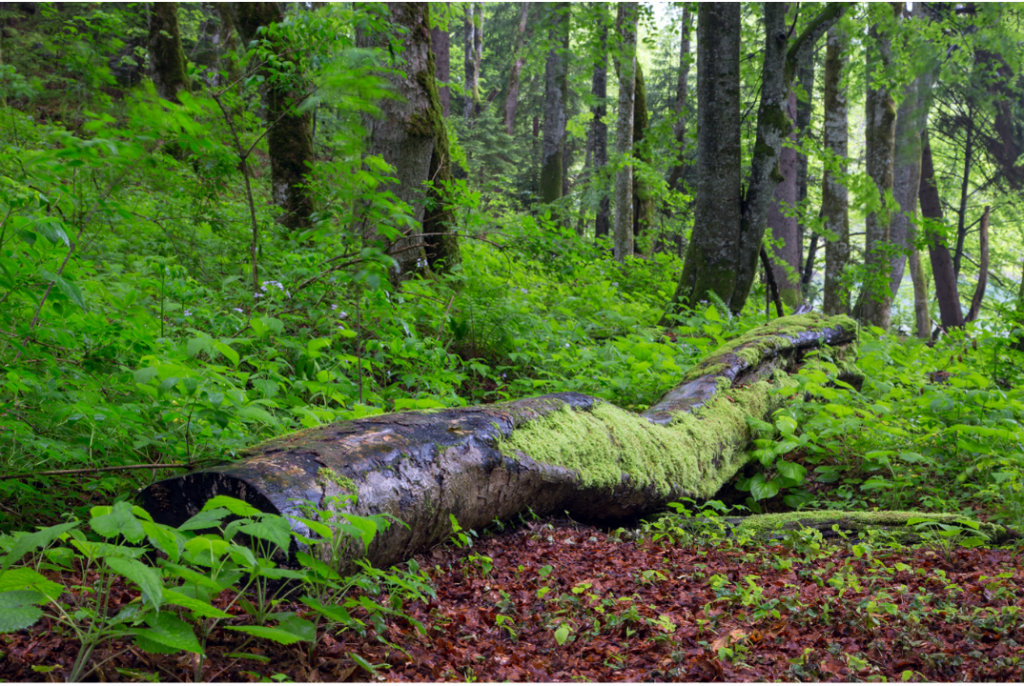
(Forest, ©Canva)
This article aims to provide a better understanding of this problem and the issues at stake. It also shows the role that technological and scientific progress can play in better understanding the causes and consequences of forest health degradation in threatened regions.
The concept of a healthy forest has universal appeal. However, forest ecologists and managers are struggling to define this concept exactly. Thus, to date, there is no universally accepted definition for forest health.
Most definitions of forest health can be classified according to their ecological or utilitarian perspective. From an ecological perspective, current understanding of ecosystem dynamics suggests that healthy ecosystems are those that are able to maintain their organisation and autonomy over time while remaining resilient to stress ([1] Edmonds et al 2011, [2] Raffa et al 2019).
On the other hand, the utilitarian perspective holds that a forest is healthy if management objectives are met. Consequently, a forest is unhealthy if these objectives are not met. This definition may be appropriate when there is a single, unambiguous management objective, such as timber production or the maintenance of wilderness attributes. It is, however, too narrow when multiple management objectives are required.
Finally, other forest ecologists incorporate both ecological and utilitarian perspectives into their two-part definition of forest health. First, healthy forest management should be based on its intrinsic physical properties (size, elevation, climate). This includes matching basic tree mortality to observed mortality. Secondly, a healthy forest should meet the objectives of the owner/government, provided that these objectives do not conflict with sustainability ([3] Teale and Castello 2011).
Interestingly, forest health is often defined from the “natural” perspective of the forest, or from the perspective of forest managers. We are therefore in a position to ask the questions: what are those management actions that aim to improve forest health? And why simply leave the forests untouched, which intuitively seems to be the best solution?
In 2019, the Food and Agriculture Organisation of the United Nations (FAO) is setting the guidelines for what is intended to be sustainable forest management. In view of the numerous forest fires, too devastating for ecosystems, a strategy was needed. This document, “Fire-smart forest management”, describes the methods, regulations and indicators used to perfect the remedy for poor forest health.
Among these standards are explanations of how to cut down old trees. And so a wave of tree cutting begins. A wave that could be mistaken for deforestation. Indeed, the uninformed walker is indignant to see trunks littering the ground of his favourite forest. However, here are the explanations needed to understand this measure.
One of the main causes of poor health of forest areas is an excess of trees and especially an abundance of trees of the same age. Firstly, too many trees per square metre means that there is little light. This results in few flowers and low vegetation and ultimately very little diversity. The soils under these forests are also of poor quality, lacking in bio-organisms.
We now know that the diversity and cyclicality of ecosystems often make them sustainable. The second point related to the abundance of old trees is fires. Forest fires are not bad in themselves. They have been part of the sustainability of ecosystems since long before man. However, in our case, if a fire breaks out, everything is lost. The soil is no good, nothing will grow back for a long time: the cycle is broken, sustainability is restricted.

(Unhealthy forest, What is a Healthy Forest ? , ©Jeffco Open SPace, Youtube)
Thus, these two arguments together justify cutting down thousands of old trees and planting new growth. Having a difference in the age of the trees leads to a lower risk of forest loss by fire and less fire in general. Fewer trees brings more diversity. It provides more space for animals and other forest dependents (mosses, flowers, low vegetation). All of these cascading implications result in better soil condition, and thus possible renewal, in other words: a sustainable ecosystem.

(Healthy forest, What is a Healthy Forest ? , ©Jeffco Open SPace, Youtube)
However, assessing the need for and strength of management actions in an area of interest is not an easy task. To achieve this, ecologists and forest rangers are now using computer tools. They allow to quickly visualise these areas as well as the sources of the problems.
More than ever, it is necessary for environmental decision-makers to use new computer technologies. They allow the observation, understanding and prediction of multiple changes in regions of interest. At Murmuration, as at many other environmental and IT consultancies, satellite images are the main source of this data. In Europe, the Copernicus environmental observation programme has enabled the use of such images through the launch of the Sentinel satellites. Sentinel-2, in particular, has been given the task of providing European countries with comprehensive and up-to-date data for environmental monitoring and surveillance. For the issue of forest health, three main indicators are derived from the processing of these images: NDVI, LAI and FAPAR.
The Normalized Difference Vegetation Index (NDVI) is a simple graphical indicator. It can be used to analyse remote sensing measurements. Often based on a spatial platform, it assesses whether or not the observed target contains living green vegetation.
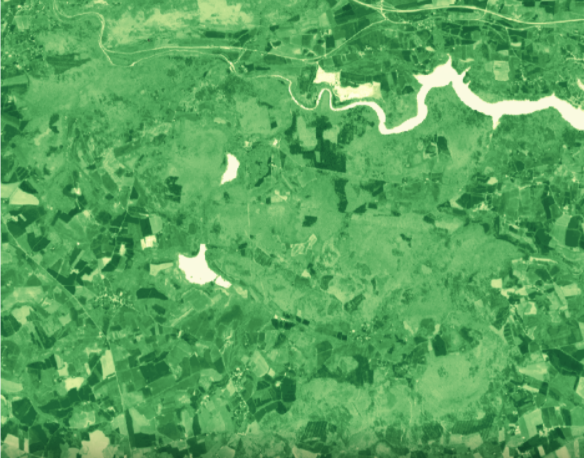
(NDVI of a forest in Bretagne, France in March 2021, 10mx10m resolution)
The Leaf Area Index (LAI) is a dimensionless quantity. It expresses the leaf area of a tree or ecosystem per unit area of soil. It is determined by calculating the total leaf area of the plant on the soil surface it covers.
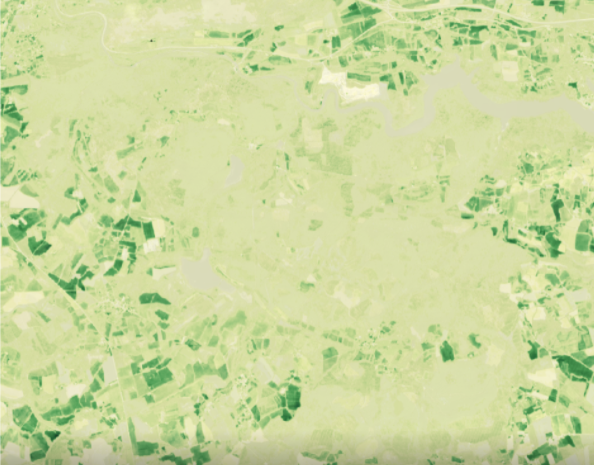
(The LAI of a forest in Bretagne, France, in March 2021 at 10mx10m resolution)
FAPAR is the fraction of solar radiation entering the spectral region of photosynthetic radiation that is absorbed by an organism. This biophysical variable is directly related to the productivity of photosynthesis. Some models use it to estimate the assimilation of carbon dioxide in vegetation. As seen previously, this carbon assimilation is very important for understanding the participation of the area under consideration in global gas exchanges.
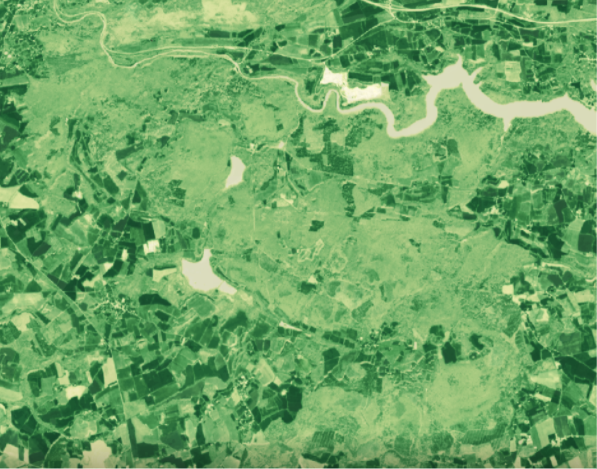
(FAPAR of a forest in Bretagne, France, in March 2021 at 10mx10m resolution)
Thanks to these satellite images, it is possible to visualise the evolution of ecosystems. This makes it possible to conceptualise the actions to be taken. It is by considering these indicators that the management of forest areas can be done effectively.
Forests are the lungs of the Earth, they are also the terrestrial receptacles of plant and animal biodiversity. Yet there is a lack of information on their management, whether in France or elsewhere. Contrary to what one might think, leaving a forest alone is not always equivalent to helping it.
At Murmuration we use these environmental indicators to go one step further. Indeed, the jointness and correlation between these variables and other indicators, both ecological and social, allow us to highlight the impacts of humans on biodiversity and the evolution of a vegetated region. Once highlighted, these issues are intended to be the arguments for tomorrow’s decisions.
[1] – Edmonds, R.L.; Agee, J.K.; Gara, R.I. 2011. Protection et santé de la forêt.
[2] – Raffa, K.F.; Aukema, B.; Bentz, B.J. [et al]. 2009. Une utilisation littérale de la “santé des forêts” permet de se prémunir contre les abus et les mauvaises applications. Journal de pratique forestière.
[3] – Teale, S.A. ; Castello, J.D. 2011. Le passé comme clé de l’avenir : une nouvelle perspective sur la santé des forêts.
Authors : Mael Plantec, Remi Nassiri
The IUCN (International Union for Conservation of Nature) stated that “plastic pollution is the most widespread problem affecting the marine environment”. Most of this pollution ends in the plastic oceans.
Plastics take centuries to degrade and contaminate the entire food chain. Each year, up to 13 million tons of plastic end up in the oceans because it is not recycled. Current estimates indicate that there is about 150 million tons of plastic found in the ocean. In 2018, the UN environment program placed the issue of plastic in the ocean among the six environmental emergencies of greatest concern.
Active methods of plastic removal are required to address this issue. Being able to detect and track plastic litters is crucial to enable these methods. There are three main approaches to track them: numerical modelling, in situ observation and earth observation satellite images.
Most of ocean plastic comes from rivers. Knowing the main points of origin and using data on ocean currents and on vertical mixing of water layers, it is possible to model the probable trajectory of plastic litter and the areas where they will stagnate and concentrate. The Copernicus Marine Service provides ocean current models that are used for this purpose.
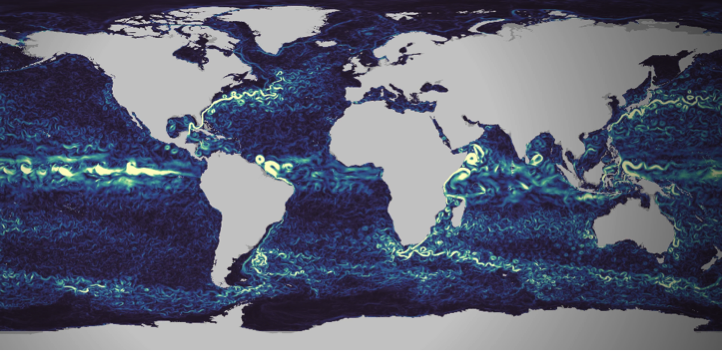
Figure 1 : Visualization of Copernicus Marine currents numerical models, extracted from https://myoceanlearn.marine.copernicus.eu/
Local measurements are regularly performed to understand and quantify the issue’s importance. With statistical processing of the collected data, these measurements campaigns allow to build and calibrate the plastic litter tracking models (see for instance van Sebille et al.).
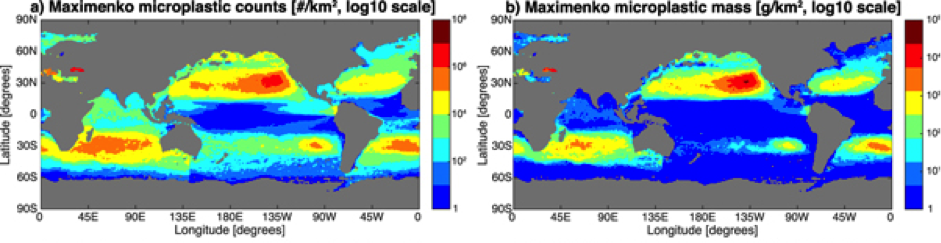
Figure 2 : Maps of microplastic count (left column) and mass (right column) distribution for one of the studied statistical models, extracted from the work of Van Sebille et al.
99% of ocean plastic lays at the bottom of oceans, whereas only 1% floats on the surface. Remote sensing from space therefore suffers from a structural limitation that will never make it a self-sufficient solution to the problem. However, with their ability to cover large et inaccessible areas, using satellite images is an innovative approach that can complement modelling and in-situ observation. While still at the research and development stage, many research groups carry out experiments. They have to work with the tools at their disposal, which are not initially designed for this task.
The European Earth Observation Copernicus program offers different options here. First is the satellite Sentinel 3, dedicated to ocean observation. It is though designed to monitor large-scale oceanic processes. Its 300 meters resolution does not make it an adequate tool for plastic monitoring.
The Sentinel-2 satellite is an interesting alternative. It provides images in the visible part of the spectrum with a 10 to 20 meters resolution. Small pieces of plastic are not noticeable. However when they aggregate into large clusters they become more likely to be detected by satellites with such spatial resolution.
Sentinel-2 has been studied as a solution to ocean plastic monitoring by many research groups (see the work performed by a group from 25 different institutions, or this work carried out by a group from the Plymouth Marine Lab in 2019). However It has been initially designed for land monitoring. While its orbit covers all the earth, images are not collected on the wide open ocean areas. Images are only available on continental coastal areas and around islands. It is still though a very interested approach showing interested results in the covered areas.
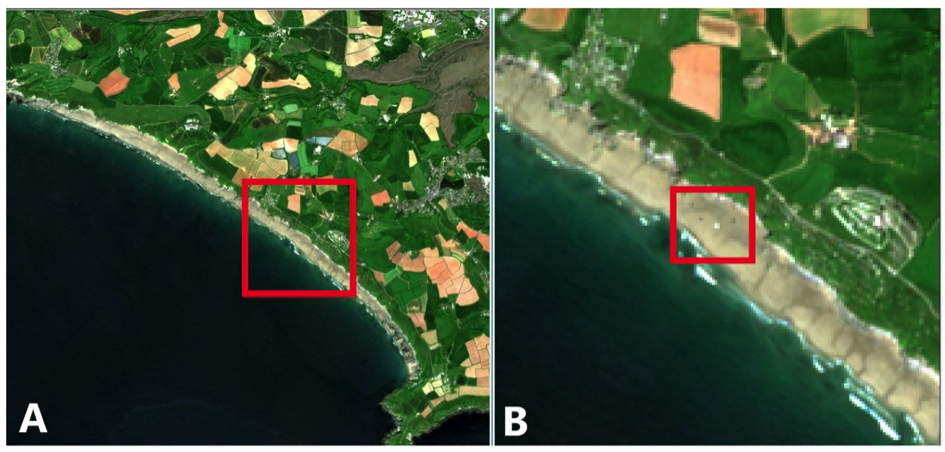
Figure 3 :Example of plastic detection on a coastal are using Sentinel-2 images. Extracted from the work of the Plymouth Marine Laboratory
Earth observation satellite programmes mainly focus on land. Coverage of the oceans is limited to the observation of global phenomena, with a relatively low resolution (~300m).
Higher resolution observations are available over coastal areas.
However, most plastic waste is deposited on the ocean floor. It is therefore not observable by satellites. Those that remain on the surface can accumulate in clusters visible from space.
Observation from space should be considered as a complementary solution. It can be used to detect plastic waste in coastal areas before it is dumped.
Earth observation is thus a useful data source for flow analysis and waste tracking models. It provides a wide and systematic spatial coverage that ideally complements the more accurate but local and punctual in-situ observations.
Finally, it is important not to stop thinking about the role of space observation in ocean pollution control. Indeed, satellites are evolving, and so are observation tools. Improved resolution could allow for more detailed observation of plastic waste in the oceans. Going from 300 m resolution to 20 m with global coverage of the oceans would be a major advance. This would make it possible to position space observation at the centre of the tools and means for sustainable action in the oceans.
Setting up this type of mission takes time, but the plastic crisis in the oceans could lead space observation down this path.
Authors : Fabien Castel, Rémi Nassiri
A fortnight ago, the World Health Organisation (WHO) published an update of its air quality guideline. This has not happened since 2005. Therefore, this is a major scientific and societal event. The need for air analysis to evolve in line with technological and scientific advances pushed for this intervention. Moreover they demonstrate the highly dangerous and damaging effects of poor air quality on human health.
Indeed, the WHO estimates that air pollution causes 7 million premature deaths. But it also means millions of years of lost life expectancy.
Air pollution is highly dangerous for our health and our planet. This is why the WHO has drastically lowered the air quality thresholds. Because at this level, they reveal the danger of elements present in the air, even in smaller quantities.
This intervention also sounds the alarm. Thus, the international organisation alerts the authorities for the need to act more quickly and effectively against air pollution.
Air quality has a direct impact on human health (UN Sustainable Development Goal 3, Good health and well-being). In addition, it has serious consequences for the environment in general (UN Sustainable Development Goal 15, Life on Earth). Various chemical compounds emitted by human activities alter this air quality.
Particularly noteworthy is fine particle pollution. This is aggravated by various anthropogenic factors (industry, heating, building sector, transport and road traffic). It causes respiratory diseases, cardiovascular problems and complications in infants.
Nitrogen oxide (NOx) pollution covers another dimension of the problem. It leads to acidification of precipitation, which alters soils and waterways, unbalancing many ecosystems. These pollutants are mainly emitted by road traffic. Moreover, they can travel long distances from their place of emission and affect sensitive ecosystems. Consequently, the limitation of these emissions in areas with heavy road traffic (i.e. urban areas) is mainly a health issue. It is not only a local one but also a global one, in order to preserve our common environment.
The thresholds defined by the WHO were lowered between the last version of 2005 and the recent update. This decision is justified by extensive epidemiological research. The results obtained on a large scale in recent years are worrying. They reveal the significant long-term impact of these pollutants, even in small doses. For fine particles, the threshold value has been divided by 2. This translates into a reduction from 10 µg/m3 in 2005 to 5 µg/m3 in 2021. For NO2, the strengthening of the directive is even more important. The threshold has been reduced from 40 µg/m3 in 2005 to 10 µg/m3, thus being divided by 4 today.
Modern Earth observation tools make it possible to monitor the concentration of pollutants in the air from space. This is made possible and accessible by the European Copernicus programme, and in particular the Atmosphere service. From observations collected by the Sentinel 5 satellite, scientists and engineers produce daily data.
These data cover the whole world. They provide an objective, high-level measure (average value aggregated over a 10-kilometre resolution grid) of air quality. They can be used systematically anywhere in the world, and are therefore an invaluable analytical tool.
Comparing, for example, the emissions of several large European cities, we can already see the differences. With the new WHO recommendations, we can see that some cities stand out. Among them, Spanish cities are among the best.
The following graph focuses on the concentration of nitrogen dioxide (NO2) in the air. Here it focuses on 4 European cities over the last 3 years. The cities are Madrid, Bilbao (in red and blue), Athens and Rome (in yellow and green). The orange line represents the WHO recommendation.
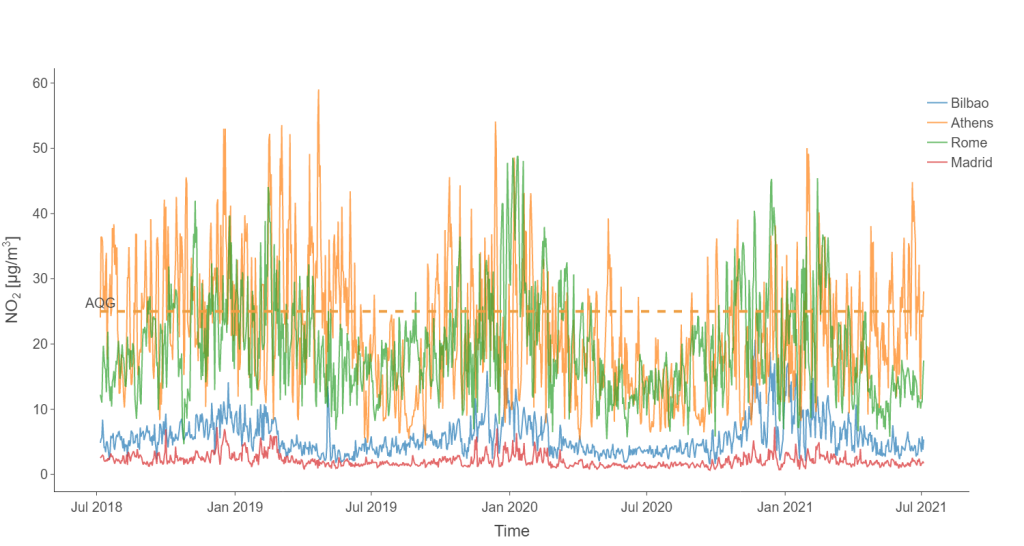
(Graphique des taux de concentration de dioxyde d’azote (NO2) dans l’air, pour les villes de Athènes, Bilbao, Madrid et Rome)
This comparison between southern European cities clearly shows the difference in NO2 pollution. Cities like Rome and Athens are well above the new WHO framework. In contrast, Madrid and Bilbao remain well below.
The situation for fine particles is relatively similar. Indeed, Madrid and Bilbao are both below the WHO thresholds. These observations are illustrated by the graph below (using the same colour code as above).
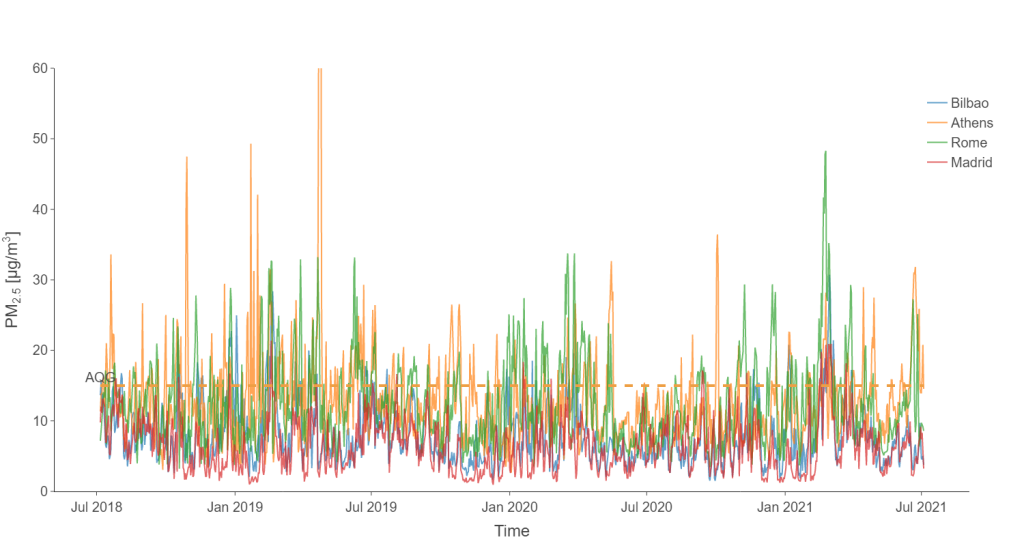
However, over the last 3 years, Madrid and Bilbao have had average levels below the limits set. As for the peaks, they remain much lower than those of the other cities. As a result, air pollution in these Iberian cities is much lower than in Rome or Athens.
So what can explain such a low level of pollution in these Spanish cities? The answer surely lies in the road traffic regulation measures taken by the cities in recent years. Madrid introduced large low-emission zones in the city centre in November 2018. In Bilbao, the speed of vehicles in the city centre has been restricted to 30 km/h since May 2018.
Finally, the data collected on site tends to prove these Spanish cities right. To demonstrate this, in-situ sensors are used. These allow the evolution of nitrogen dioxide pollution to be followed over a long period. The following curve shows the evolution of the nitrogen dioxide pollution index of the World Air Quality Index in Bilbao.
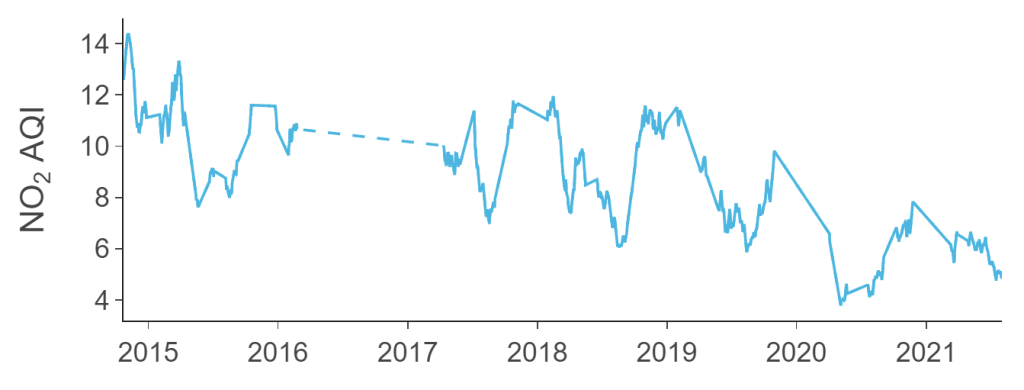
The downward trend is clear in 2020, but should be taken with caution. In this period, the health crisis also had a strong downward impact on emissions.
However, it continues strongly into 2021, which is a very encouraging sign.
Moreover, this could quickly confirm the lasting positive effect of efforts to regulate road traffic in urban areas. There is therefore great hope for the consequences and success of similar measures in other European cities.
Authors : Fabien Castel, Remi Nassiri
Global warming, pollution, degradation of cultural sites, deforestation … the effects of overtourism on the environment and populations can be dramatic.

MURMURATION is one of the start-ups that has joined the acceleration program of Climate-Kic France . This program is intended for all start-up companies that are motivated and committed to solving the problems related to climate change. Thanks to Flockeo, we want to implement an inclusive approach!
Over-tourism, over-crowding of sites and the under-frequenting of other sites which, however, have put in place the necessary infrastructures are critical for travel professionals who see their “working tool” deteriorate or, conversely, little known. MURMURATION has developed a solution that combines environmental studies and a web platform, Flockeo, in order to provide reliable indicators to manage a tourist destination, to make it known and to make visible the daily work of the traveling professionals who commit themselves.
Some places are not suitable to receive too many travelers. In Venice, for example every year millions of visitors for some tens of thousands of Venetians who live there. Unesco has also listed the city on the list of World Heritage in Danger. This was also the case for the city of Dubrovznik in Croatia last summer.
For example, the need for water to fill pools in hotels and fossil fuels, for example to cool in countries where resources are very limited, can create major problems. The countries of the Mediterranean are the most exposed because most of them favor mass tourism without implementing the necessary infrastructures.
The most infamous example is the Maya Bay beach from the movie “The Beach” with Leonardo Di Caprio. This beach was closed by the Thai authorities until 2021 to allow the coral reefs to reform and thus prevent the erosion of the bay. The damage to the natural ecosystem of this bay is such that the beach had to be closed to motorboats and tourists.
The growth of tourism by 2050 will double energy consumption and greenhouse gas emissions. The carbon footprint of tourism is generated by transport but also by the need to produce all that tourists need on their vacation spot. The two tourist cities, Jakarta and Denpasar, in Bali are among the most polluted cities in the world.
Satellite images are a powerful tool for Earth observation and monitoring sensitive areas. As part of the Copernicus program and mandated by the European Commission, ESA (European Space Agency) has implemented the Sentinel satellites, the guards of the planet. Thanks to this program, we could detect hydrocarbon pollution at large of the Brazilian coasts and provide evidence for local authorities to help uncover the origin of this major disaster.
At MURMURATION, we confirm the catastrophic situation that these Brazilian coasts are currently experiencing. As shown in the following Sentinel images, we are able to detect oil pollution off the Brazilian coasts in the east, in the state of Bahia.
Oil slicks are observed spanning over 20km, which corresponds to 800 Tennis courts!
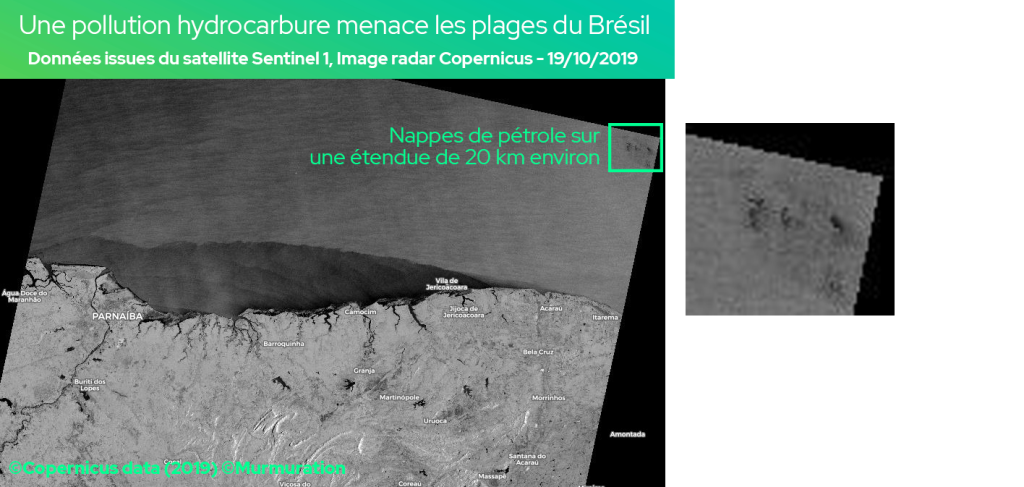
The Sentinel 1 radar images of the Copernicus program provide all-weather imagery (passing through cloud cover) thus enabling the handling of emergency situations (natural or industrial disasters) and environmental monitoring (sea ice, glaciers, water extents, landslide, and so on).
An extent of about 10 km of oil slicks was observed off Açu de Torre … which corresponds to nearly 400 tennis courts!
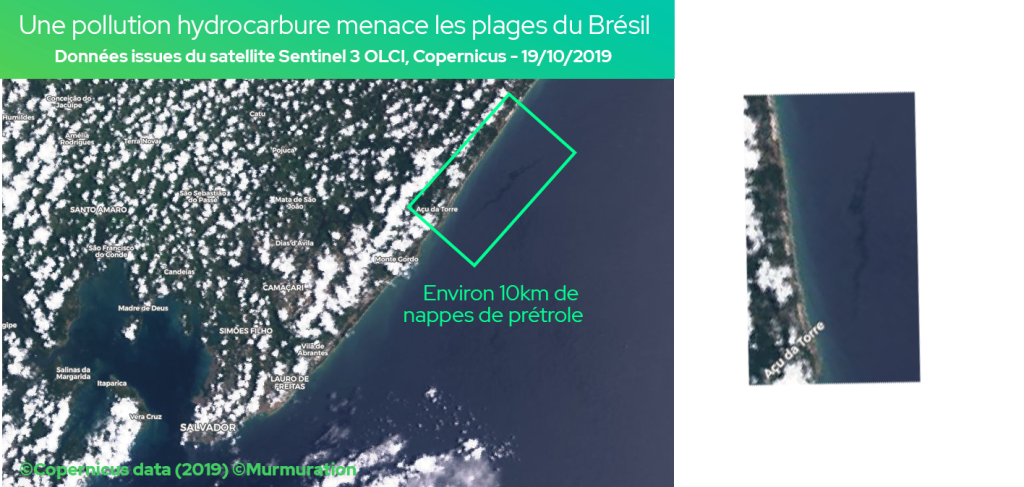
Sentinel 3 OLCI satellite images (Ocean and Land Color Instrument) allow measuring the state of the oceans and coastal zones (pollution, current …) thanks to color levels (spectral bands).
The Brazilian oil spill is an unprecedented ecological disaster with a short, medium and long-term impacts on the natural ecosystems and the economy of the country. Marine ecosystems are becoming stagnant while the country’s economy can be affected. Brazilian beaches, reputed for their beauty and attracting tourists from all over the world, may be deserted by travelers. The tourism sector is already heavily impacted by the situation ! But the worst is yet to come : Cleaning is almost impossible under current conditions.
O óleo no Nordeste e a destruição da Amazônia mostram as consequências do desmonte ambiental promovido pelo governo, prejudicando a imagem do país. Os impactos são gravíssimos para os oceanos, a Amazônia e a vida das pessoas. https://t.co/1PR9Rh6a1B #InimigoDoMeioAmbiente pic.twitter.com/sfZd2MxEla
— Greenpeace Brasil (@GreenpeaceBR) October 23, 2019