As a UNICEF report reminded us this summer, the lack of water in some parts of the world is having serious consequences for people. This lack of access to water for populations is commonly referred to as “water stress”.
Today, several regions of the world are suffering from water stress. According to the World Resource Institute, 17 countries have an “extremely high” probability of water stress. These include India, Mexico, parts of China and, above all, most of the Near and Middle East.
This article aims to provide a better understanding of this problem and the issues involved. It also shows the role that technological and scientific progress can play. They will allow better understanding of causes and consequences of water stress in threatened regions.
The lack of water for populations can result from political and social causes: waste of available resources, mismanagement, conflicts. This makes it impossible for entire populations to access water. But it is also linked to economic problems of resource distribution and the uses addressed.
Finally, water scarcity is also and above all the result of physical causes, indeed, in the desert there is generally a lack of water, whatever the management policy put in place.
If the focus is on these physical aspects of the problem, the concept of water stress can be summarised in a few simple and understandable equations:
Reserves = groundwater + surface water + precipitation
Consumption = agricultural use + industrial use + domestic use
Water stress=Consumption/Reserves
Water stress is therefore the ratio between consumption needs and water reserves. If the need exceeds the quantity of water available in a given area, then that area is under water stress. The need includes all the uses of water: agriculture, industry and current consumption of the populations. Availability includes accessible renewable water reserves: surface water (lakes, rivers, etc.), groundwater and rainfall. The higher this water stress ratio, the greater the competition between uses and the greater the need for informed arbitration.
The need to arbitrate between different water uses requires effective monitoring tools. Observing both the state of available reserves and the level of consumption. Water stress indices are being developed for this purpose. One example is the initiative of the World Research Institute, a non-profit scientific organisation based in Washington. WRI researchers have developed a water stress monitoring index and an online platform to disseminate this information.
The following illustration, taken from this platform, highlights the situation in the Near East. The region, once known as the “fertile crescent”, saw the emergence of agriculture more than 5000 years before our era. Today, it is one of the most water-stressed regions on the planet.
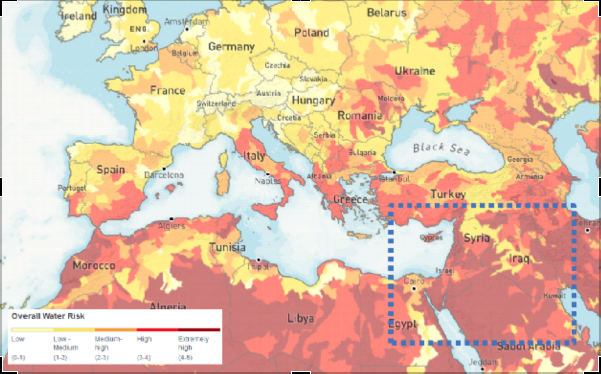
(WRI Water Stress Index Map of Europe and the Middle East, 2019)
These means are first of all extremely useful for better quantifying the available resources. Large-scale monitoring of surface water, for example, is addressed by the SWOT satellite, which will be launched jointly by CNES and NASA in 2022. This programme will make it possible to obtain consistent time series that are essential for current resource management. In addition, the monitoring of extreme events such as droughts or floods will be carried out. The Copernicus programme and its Sentinel satellites also monitor important water cycle variables such as evapotranspiration and soil conditions. In particular, the moisture in the top few centimetres of soil can be measured by the radar sensors on Sentinel-1. This is an important indication for understanding the infiltration of precipitation into the soil and modelling the state of groundwater resources.
Spatial data is also a great tool for assessing consumption needs. Large-scale land use and segmentation information from space-based observations is an indispensable basis. Sentinel satellites, for example, allow precise identification of crop type, and thus improve water use models for agricultural needs. Domestic needs can also be modelled on a large scale using urbanisation monitoring information.
These modern means of observing our planet will make it possible to set up a large-scale water stress indicator. It will be less dependent on local in-situ data that are sometimes difficult to acquire. The use of this type of data should also make it possible to obtain an indicator with a high update frequency. The revisit period of a given geographical area of the satellites considered (between a few days and a month) should make it possible to set up an indicator capable of better capturing the dynamics and evolution of water stress over time.
The integration of space observation as a tool for combating water stress therefore seems promising. It allows the monitoring of surface water, the modelling of underground resources and a better understanding of consumption. As a result, it has a real role to play in planning access to water.
This tool was actually used in 2004 during an operation in Darfur (Chad). Space observation made it possible to propose a map of the possible groundwater available in a region hosting numerous humanitarian camps. The camps were then able to use this information to set up their camps and dig wells. In this way, they are making it easier to access water.
It should be noted that at that time this international initiative used data provided by Japanese (JERS-1), American (Landsat) and European (ESA’s ERS-1 and ERS-2) satellites.
Today, the Sentinel fleet (in particular the Sentinel-1 radar tools) and the mass of free and open data that the Copernicus services produce thanks to them are favoured and should make it possible to move this type of use from research to operational services.
Authors : Fabien Castel, Rémi Nassiri
A fortnight ago, the World Health Organisation (WHO) published an update of its air quality guideline. This has not happened since 2005. Therefore, this is a major scientific and societal event. The need for air analysis to evolve in line with technological and scientific advances pushed for this intervention. Moreover they demonstrate the highly dangerous and damaging effects of poor air quality on human health.
Indeed, the WHO estimates that air pollution causes 7 million premature deaths. But it also means millions of years of lost life expectancy.
Air pollution is highly dangerous for our health and our planet. This is why the WHO has drastically lowered the air quality thresholds. Because at this level, they reveal the danger of elements present in the air, even in smaller quantities.
This intervention also sounds the alarm. Thus, the international organisation alerts the authorities for the need to act more quickly and effectively against air pollution.
Air quality has a direct impact on human health (UN Sustainable Development Goal 3, Good health and well-being). In addition, it has serious consequences for the environment in general (UN Sustainable Development Goal 15, Life on Earth). Various chemical compounds emitted by human activities alter this air quality.
Particularly noteworthy is fine particle pollution. This is aggravated by various anthropogenic factors (industry, heating, building sector, transport and road traffic). It causes respiratory diseases, cardiovascular problems and complications in infants.
Nitrogen oxide (NOx) pollution covers another dimension of the problem. It leads to acidification of precipitation, which alters soils and waterways, unbalancing many ecosystems. These pollutants are mainly emitted by road traffic. Moreover, they can travel long distances from their place of emission and affect sensitive ecosystems. Consequently, the limitation of these emissions in areas with heavy road traffic (i.e. urban areas) is mainly a health issue. It is not only a local one but also a global one, in order to preserve our common environment.
The thresholds defined by the WHO were lowered between the last version of 2005 and the recent update. This decision is justified by extensive epidemiological research. The results obtained on a large scale in recent years are worrying. They reveal the significant long-term impact of these pollutants, even in small doses. For fine particles, the threshold value has been divided by 2. This translates into a reduction from 10 µg/m3 in 2005 to 5 µg/m3 in 2021. For NO2, the strengthening of the directive is even more important. The threshold has been reduced from 40 µg/m3 in 2005 to 10 µg/m3, thus being divided by 4 today.
Modern Earth observation tools make it possible to monitor the concentration of pollutants in the air from space. This is made possible and accessible by the European Copernicus programme, and in particular the Atmosphere service. From observations collected by the Sentinel 5 satellite, scientists and engineers produce daily data.
These data cover the whole world. They provide an objective, high-level measure (average value aggregated over a 10-kilometre resolution grid) of air quality. They can be used systematically anywhere in the world, and are therefore an invaluable analytical tool.
Comparing, for example, the emissions of several large European cities, we can already see the differences. With the new WHO recommendations, we can see that some cities stand out. Among them, Spanish cities are among the best.
The following graph focuses on the concentration of nitrogen dioxide (NO2) in the air. Here it focuses on 4 European cities over the last 3 years. The cities are Madrid, Bilbao (in red and blue), Athens and Rome (in yellow and green). The orange line represents the WHO recommendation.
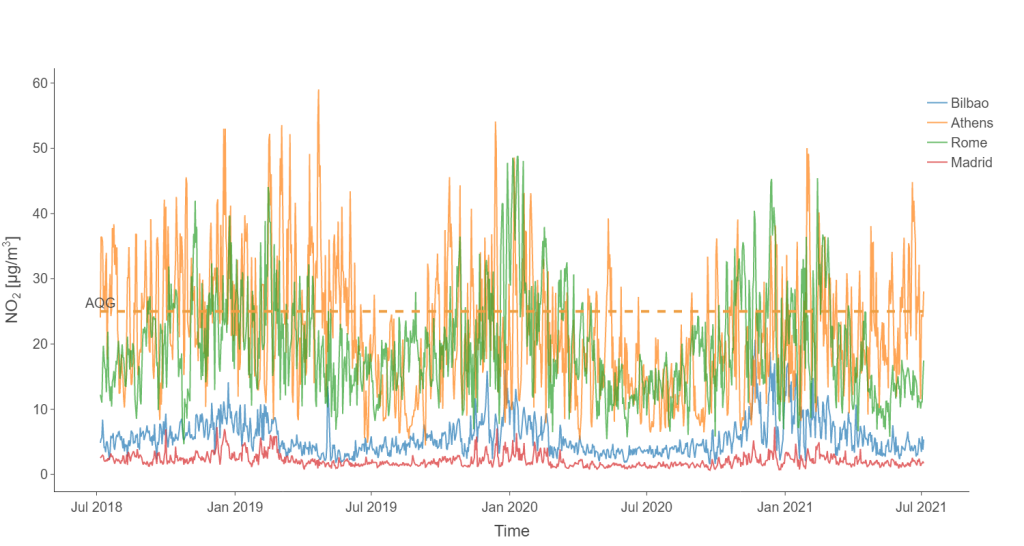
(Graphique des taux de concentration de dioxyde d’azote (NO2) dans l’air, pour les villes de Athènes, Bilbao, Madrid et Rome)
This comparison between southern European cities clearly shows the difference in NO2 pollution. Cities like Rome and Athens are well above the new WHO framework. In contrast, Madrid and Bilbao remain well below.
The situation for fine particles is relatively similar. Indeed, Madrid and Bilbao are both below the WHO thresholds. These observations are illustrated by the graph below (using the same colour code as above).
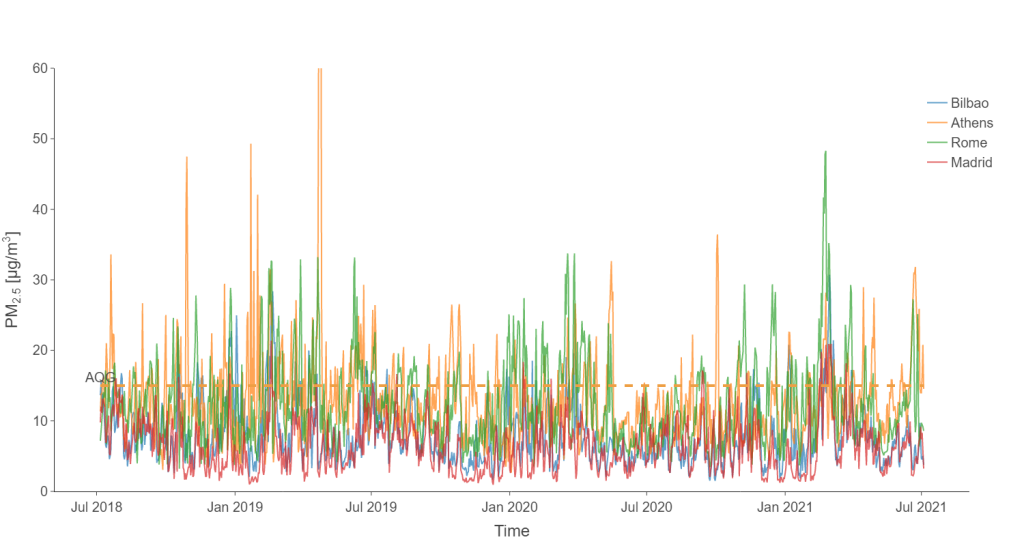
However, over the last 3 years, Madrid and Bilbao have had average levels below the limits set. As for the peaks, they remain much lower than those of the other cities. As a result, air pollution in these Iberian cities is much lower than in Rome or Athens.
So what can explain such a low level of pollution in these Spanish cities? The answer surely lies in the road traffic regulation measures taken by the cities in recent years. Madrid introduced large low-emission zones in the city centre in November 2018. In Bilbao, the speed of vehicles in the city centre has been restricted to 30 km/h since May 2018.
Finally, the data collected on site tends to prove these Spanish cities right. To demonstrate this, in-situ sensors are used. These allow the evolution of nitrogen dioxide pollution to be followed over a long period. The following curve shows the evolution of the nitrogen dioxide pollution index of the World Air Quality Index in Bilbao.
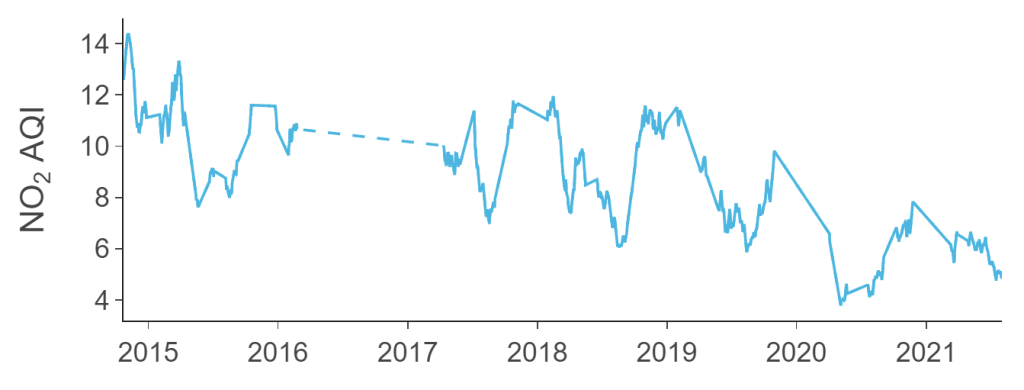
The downward trend is clear in 2020, but should be taken with caution. In this period, the health crisis also had a strong downward impact on emissions.
However, it continues strongly into 2021, which is a very encouraging sign.
Moreover, this could quickly confirm the lasting positive effect of efforts to regulate road traffic in urban areas. There is therefore great hope for the consequences and success of similar measures in other European cities.
Authors : Fabien Castel, Remi Nassiri

Tomorrow, millions of people around the world will leave their jobs or homes to join the global climate strike on the streets and demand the end of the fossil fuel era.
What is essential in your growth strategy and sustainable development? Spatial data
(more…)The attractiveness of natural and touristic areas with a rich biodiversity is a major concern in the definition of sustainable management of tourist areas. These natural areas are much more sensitive to the tourist pressure induced by the increasing number of roads, an increasing urbanization and a growing number of travelers to host, guide, restore, etc. Natural ecosystems are the first victims of overcrowding in areas that were previously difficult to access. Excessive crossing on natural paths causes significant damage to vegetation, soil and water quality. The local populations are faced with financial issues such that for most of them, they leave their craft and agricultural activities and they devote themselves totally to the tourism activity, becoming totally dependant on it.
It is the responsibility of all actors to help safeguard naturals and touristic areas : tourists, tourism professionals, local officials, associations and NGOs. Everyone must work together to put in place environmental management that is conducive to both the economic and social development of these residents. Tourism activity can be a real promise of economic and social development, while preserving biodiversity in a sustainable way. Travel, within the framework of a sustainable tourism, is an encounter with a country and the complexity of its history, its cultures, its cults, its biodiversity, its ecosystems, it’s about Life and Earth.
Our emerging collaboration with Julien Leroy, founder of Terra Nordeste, is inscribed in this context. Julien describes his activity as a “craftsman of the journey”, he furrowed for almost 15 years the most beautiful natural places of Brazil. He literally fell in love with this country. He describes those places as of a wild and catchy beauty, but they are also very fragile and threatened: “I try to propose the most authentic and the most respectful trip possible of the country. I will soon collaborate with the Toulouse company “Murmuration”. It will provide me with satellite data so that I can visualize the impact of tourism in the regions where I work. It will allow me to act accordingly. ” Interview with Julien Leroy, Founder of Terra Nordeste.
Some solutions exist, one of them is to integrate satellite data into a collaborative approach to observe a dedicated area based on reliable data and difficult to contradict. The satellite allow us to go back in time, identify problems but also solutions and predict future developments. They are valuable and factual.
Copyright credit illustration ESA
If tourism is responsible for 8% of global greenhouse gas emissions, it is also a factor in preserving the environment through the development of new trends such as sustainable tourism.
The exponential growth of tourism activities and the emergence of the world’s middle class are exerting considerable environmental pressure on the most popular destinations. The assessment of this environmental pressure is generally of interest to travelers and decision-makers. However, despite its obvious importance for all stakeholders, environmental information is not available and therefore not a decisive factor when choosing a destination. This is mainly due to the difficulty of evaluating the impact of tourism activity, excluding transport. Knowing that tourism accounts for 10% of global GDP, the development of environmental indicators indexed to tourism activity is of paramount importance. The provision of this information at the global, regional and local levels is of utmost importance for sustainable environmental and economic activity.
Our proposal aims to develop a service providing this information: measuring and monitoring the environmental pressures due to tourism activities and transmitting them to all stakeholders.