TSDI (Tourism Sustainable Development Index) is a sustainable tourism index developed by Murmuration and based on Earth observation space data and socio-economic data.
TSDI reflects the correlation between the economic development of tourism and its environmental impact. It is inspired by Professor Jason Hickel’s Sustainable Development Index (SDI), which aims to evolve the HDI (Human Development Index) to include environmental impact.
The added value of TSDI is the addition of a tourism dimension. In addition, the SDI assesses developments at a country level, while TSDI obtains a finer measure based on available data extracted from satellite remote sensing data.
The development of TSDI has led to the creation of a map on the Flockeo website (Flockeo is a platform which aims to develop sustainable tourism). This map provides travelers with scientific information on a country’s sustainability, helping them to choose a vacation destination that respects the 3 pillars of sustainable development.
Sustainable tourism is defined by the World Tourism Organization (UNWTO) as “tourism that takes full account of its current and future economic, social and environmental impacts, addressing the needs of visitors, the industry, the environment and host communities“. It aims to achieve a balance between the three pillars of sustainable development in the production and implementation of tourism activities.
Sustainable tourism is also about the responsibility of individual travelers. They can take action by paying attention to their travel behavior (waste sorting, respect for protected areas, responsible water use, etc.) and their choice of tourism operators or destinations, according to sustainability criteria.
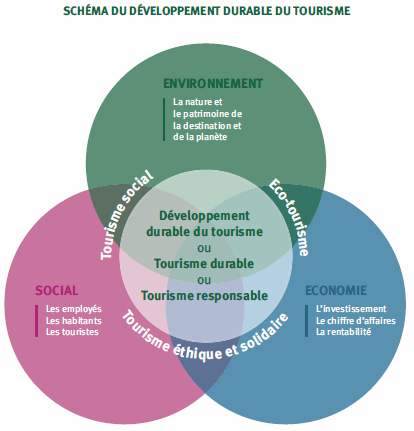
Figure 1 – The three pillars of sustainable tourism (Atout France)
TSDI is calculated by combining two components:
TSDI is mathematically a ratio between these two factors. Human and Tourism Development is the numerator. The higher it is, the higher TSDI. Environmental Risk is placed in the denominator. The higher it is, the lower TSDI. Each component is developed from sub-indicators. TSDI is rated on a scale of 1 to 10
This component is developed from the following sub-indicators:
Health is assessed by comparing the life expectancy of inhabitants with the highest and lowest life expectancy recorded among the countries of the world over the current period. The data comes from INSEE.
The level of education is assessed by comparing each country with the highest level of education in the world. It is based on the average between the number of years spent at school by the adult population (+ 25 years old, sexes combined) and life expectancy at school from kindergarten to higher education. Data supplied by Unesco.
Quality of life is measured by Gross Domestic Product (GDP) per capita. GDP per capita is assessed by comparing each country with the highest and lowest GDP in the world. The data comes from the International Monetary Fund.
This indicator provides information on the volume of tourist arrivals per year (international tourism). The total number of visitors is divided by the country’s population to obtain a number of tourists per inhabitant. Tourist attractriveness is assessed with a threshold of 2 tourists per inhabitant. Data from UNWTO.
This indicator shows the amount of tourism income generated in a country. A threshold is set at 10 billion dollars, beyond which countries that exceed it have the highest possible score and are not further valued. Data supplied by UNWTO.
This component is developed from the following sub-indicators:
Air quality is assessed over the year (previous year of current year). The satellite data used come from CAMS, Global atmospheric composition.
Six contaminants are assessed according to WHO criteria:
WHO criteria set daily limits not to be exceeded in ?g/m3. The effective concentrations of contaminants in the area are averaged over the day and compared with these limits. If all average concentrations respect these limits, then the day studied is counted as a respected day over the period studied. This process is repeated for each day of the study period to establish a score on a scale of 0 to 10. If 90% of the time during the studied period, the contaminants emitted are below the limits, then the risk is considered zero for TSDI. Thanks to satellite data, all countries are evaluated on this indicator.
The Water Resources score is based on an aggregate indicator derived from the work of the World Research Institute (Aqueduct platform). It includes a dozen indicators, such as water stress and flood risk. This risk is converted into a score for TSDI. The total is then converted into a score from 0 to 10. 127 countries are evaluated on this indicator.
This sub-indicator indicates the preservation of forest cover over the last 20 years. A country that has preserved or increased its forest cover over this period will be rated highly. On the other hand, a country that has deforested will receive a low score. The data source is the Modis satellite indicator ” “MOD44B.006 Terra Vegetation Continuous Fields Yearly Global 250m”.
The evolution of the forest between 2003 and 2010 is compared with the evolution between 2011 and 2020. To achieve zero risk, the area’s forest must be preserved. If the forest trend is negative, deforestation is taking place and the environmental risk is increasing. Thanks to satellite data, all countries are assessed on this indicator.
A fourth indicator has been added to compare carbon emissions linked to national consumption (Global Carbon Atlas) with the government directives put in place as part of the Paris Agreement1 (Nationally Determined Contributions).
56 countries2 are evaluated on this sub-indicator. Global Carbon Atlas data estimates carbon emissions generated by a country’s consumption (local production and imports), which is different from territorial emissions (local production and exports). NDCs are studied in the context of net emissions reduction. The difference between these two data provides a score, always evaluated from 0 to 10. A maximum deviation of 12.5% between decisions and actual emissions is tolerated within TSDI.
Countries are eligible for TSDI if they provide UNWTO with up-to-date data on their tourism activity. This is the guarantee that the country has a tourism activity.
A country is eligible for TSDI if it provides sufficient data to calculate the sub-indicators. The absence of data can lead to biased results. At least two indicators are required for each TSDI component. Furthermore, if the education and life expectancy indicators are missing, then the representation of the population is zero and therefore TSDI score is penalized.
In this ranking, the latest available data are used for each indicator.
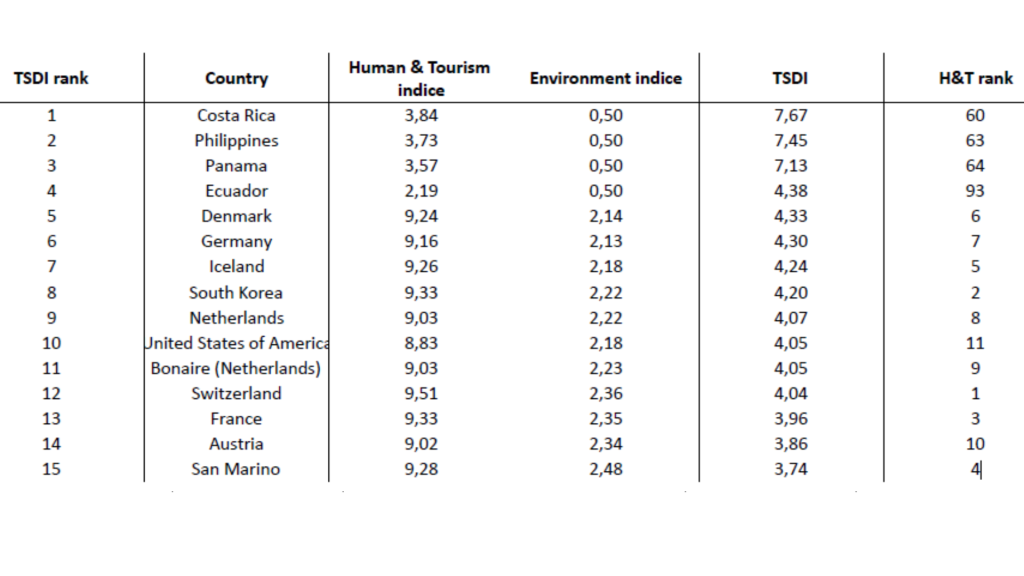

TSDI Ranking – ©Murmuration
The full results table is available for download here. For further details, please contact us at contact@murmuration-sas.com.
TSDI highlights the right balance between human and environmental development. Tourism and/or human pressure have an impact on the environmental score and therefore on TSDI.
The higher the environmental risk, the worse TSDI. The environmental risk can divide TSDI by up to 4. On the contrary, if the environmental risk is low, TSDI will be less impacted, or even valorized. This can be multiplied by two if no environmental risk is detected.
Examples: Costa Rica, the top-ranked country, presents little or no Environmental Risk. It is therefore valued and scores 7/10. To obtain 10/10, Costa Rica could increase its attractiveness to tourists, which would raise its Human Development and Tourism score.
Canada ranks 56th out of 155 in TSDI rankings. This country has been penalized in Human and Tourism Development because of a tourism affluence in 2021 close to 1/10. We can presume that the Covid-19 crisis is partly responsible for these figures. The highest Environmental Risk for this country is in Air Quality, where Canada scores 2.1/10. Ozone is responsible for this low score. This gas is produced in hot weather. It is also produced by vegetation cover (35% of Canada is covered by forests). Ozone formation is thus dependent on meteorological conditions (high solar radiation, high temperatures) and the country’s geography. Canada is therefore penalized in TSDI by ozone, which represents a risk to human health in the event of excessively high concentrations in the air.
TSDI is a sustainable tourism index that evaluates countries according to a scientific method. The sub-indicators are transparent and guarantee a reliable Environmental Risk analysis, while taking into account essential Human Development indicators. TSDI results map is available on the Flockeo website
For further details, please contact us at contact@murmuration-sas.com.
TSDI Map: Flockeo
ATD: Acteurs du Tourisme Durable
Air Quality: CAMS global atmospheric composition forecasts
Water Ressource: Aqueduct Water Risk Atlas
Forest cover: MODIS de Google Earth Engine
CO2 emissions compared with the Paris Agreement’s Nationally Determined Contributions: Global Carbon Atlas, NDC database
Life expectancy: Insee
Education: UNESCO
Gross Domestic Product: IMF
Tourism attractiveness and income: OMT
1The Paris Agreement (2015) is a legally binding international treaty on climate change. Signatory states pledge to hold “the increase in the global average temperature to well below 2°C above pre-industrial levels” and pursue efforts “to limit the temperature increase to 1.5°C above pre-industrial levels.”, https://unfccc.int/process-and-meetings/the-paris-agreement
2The 56 countries evaluated are those aiming to reduce their emissions by 2030.
Murmuration is pleased to announce its selection as the French organizer of the 3rd Cassini Hackathon, a European Union programme.
To achieve this, we have partnered with Open Tourisme Lab based in Nîmes, who bring their expertise in supporting entrepreneurs and start-ups.
This 3rd edition of the Hackathon will be on the theme of (Re)Vitalizing Tourism in Europe. It will highlight the use of technologies and spatial tools to innovate and revitalize the tourism industry in Europe in a responsible way.
To achieve this, 3 challenges have been identified: Finding sustainable destinations; Experiencing cities and cultures; Caring for our wildlife.
These challenges are aimed at students, entrepreneurs, or anyone with the desire to innovate and act sustainably.
It is therefore with pleasure that we announce that the CASSINI Hackathon will take place from 12 to 14 May 2020 in Nîmes.
The quality of air around the world is deteriorating, it is a well-known fact, and still too few people acknowledge it as the need of the hour. This article explains how Murmuration contributes in helping to combat this issue. Murmuration is a French SME created in March 2019 with the aim of introducing the environmental dimension into the decision-making cycle, focusing on tourism management institutions and stakeholders. We are using mainly earth observation satellite data, mixed with in-situ and socio-economic data.
Murmuration has developed ready-to-use indicators based on the prior mentioned data sources. Among them, the air quality indicator aims to provide insights on the evolution of major air pollutants across the globe for comparison and evaluation purposes. The indicator follows standards for data production and dissemination, such as the Open Geospatial Consortium (OGC) standards. It makes it ready to use for most of the client applications. The main objective is to help policymakers and other stakeholders identify problems at their root so that actions can be made accordingly.
The quality of air has been deteriorating since the beginning of the industrial revolution. Toxicity of the air is higher than ever before. In order to control it, it has to be monitored systematically. To do so, the World Health Organization started to establish Air Quality guidelines in 1987 to define safe levels of the air pollutants. The latest revision published in September 2021 defines six compounds as the primary air pollutants because of their significant effect on human health. It includes 4 gases (NO2, SO2, CO and O3) and 2 dust particles (PM2.5 and PM10). Each of these compounds affect human health in several different ways.
Through its air quality indicator, Murmuration aims at helping even non-experts understand the situation. The indicator studies air pollution at the level of individual compounds as well as an aggregated score including all pollutants.
The nature of the indicator and the algorithms used are explained in the following sections. The data used for computing the indicator comes from the TROPOMI instrument of the Sentinel 5P satellite.
But why using satellite data when air pollution has been monitored using ground sensors for a long time? The conventionally existing measurements based on in-situ sensors are very local to the region of measurement (say 50 m). This cannot be used to monitor the whole city unless these in-situ sensors are installed in every place in the city. But, it is a very costly process and has to be maintained consistently.
This is the place where satellite data comes to play. Even though there is a tradeoff with the spatial resolution, the data helps studying the air quality at the city level. Satellites monitor air quality at a much cheaper cost, in a scalable way (once launched and flying, it can monitor many cities with no additional cost) and are producing measurements that can be compared from one city to another making it a very good tool for evaluating and benchmarking cities with each other.
Sentinel 5P is the first sentinel satellite to monitor the atmospheric composition. The instrument measures solar light in the ultraviolet and visible, near-infrared and shortwave infrared spectral bands. The light is split into different wavelengths using a grating spectrometer and they are captured accordingly by four different detectors to measure the level of different compounds.
The raw data from Sentinel 5P is then processed, validated, georeferenced and made available for ease of access through Copernicus Atmosphere Monitoring Service (CAMS). The processed and validated data for all of the 6 above mentioned compounds are used to calculate the indicator. The 6 individual compounds are available every day at an hourly level. Daily levels are then computed with aggregation algorithms reflecting the health impact (short term or long-term ) of each pollutant (based on WHO guidelines). The aggregated data is then fed over a data transformation pipeline to be converted to the desired format.
The aggregated air quality indices are calculated at 2 different temporal levels – yearly and daily. Two different algorithms are used to arrive at the indices :
The indexes are defined at two different coverages – European and Global. This is the result of availability of raw data of Global coverage at 0.1 ° (appx. 100 km near the equator) spatial resolution and raw data of European coverage at 0.01 ° (appx. 10 km near the equator) spatial resolution. The raw data for European coverage are readily available as mass concentration in µg/m3 which is the standard used by WHO to evaluate air quality levels. On the contrary, the raw data for global coverage is not readily available in the standard format.
In the global coverage data, dust particles such as PM10 and PM2.5 are available as mass concentrations in kg/m3 which can be converted using a conversion factor. But the gases like NO2, SO2, CO and O3 are available in mass mixing ratio in kg kg-1. They have to be converted to mass concentrations using ideal gas equations. Finally, all the gases and dusts are available in mass concentrations with the same unit µg/m3.
At the end, Murmuration’s Air Quality Indicator can be used from 2 channels that Murmuration is providing:
While the map service takes care of studying the distribution of various compounds and its hotspots, the programmatic interface helps in narrowing the study to any particular area of interest and to study the change over a temporal scale.
The indicator helps in identifying problems such as pointing out regions or times of high pollution or temporal range of high pollution exposure. The World Health Organization estimates that air pollution causes 7 million premature deaths per year. This is one of the biggest environmental threats to human life. By finding out regions of concern, appropriate actions and measures can be taken by government bodies, enterprises and non-governmental organizations to mitigate the situation.
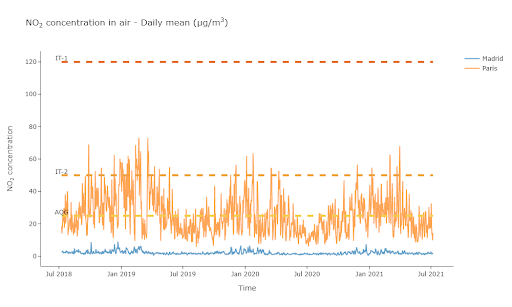
(Graph of NO2 concentration in the air in Paris and Madrid, ©Murmuration)
The above chart shows the Murmuration NO2 indicator and its evolution in Madrid and Paris over a three-year time frame.
Thanks to the indicator developed by Murmuration, it is possible to study the air quality level at the city level in a cost-effective manner. Monitoring air quality using satellite measurements will not completely replace the in-situ measurements. They act complementary to each other. While satellite measurements help in monitoring air quality at city level or higher, in-situ measurements help in monitoring air quality at street or neighborhood level (hospitals, schools, parks etc.).
This article is one among many that will be published until the end of March, explaining what Murmuration’s indicators are and their purposes.
Author : Murugesh MANTHIRAMOORTHI, Remi NASSIRI
The Flockeo platform proposes an innovative approach : Travelers become their own guides by choosing sustainable destinations!
Our approach is inspired by the European Commission’s ETIS indicator system , developed to assess the sustainability of tourism destinations. By combining satellite and statistical data, the Flockeo indicator measures the pressure of human activities on the environment. Thanks to an interactive map, users can zoom in on the destinations that interest them and know the index of the region concerned. Through a colors rating, they will be able to easily assess the impact of human activities through four criteria: the ecosystem potential, the risks related to water and the urbanization processes.
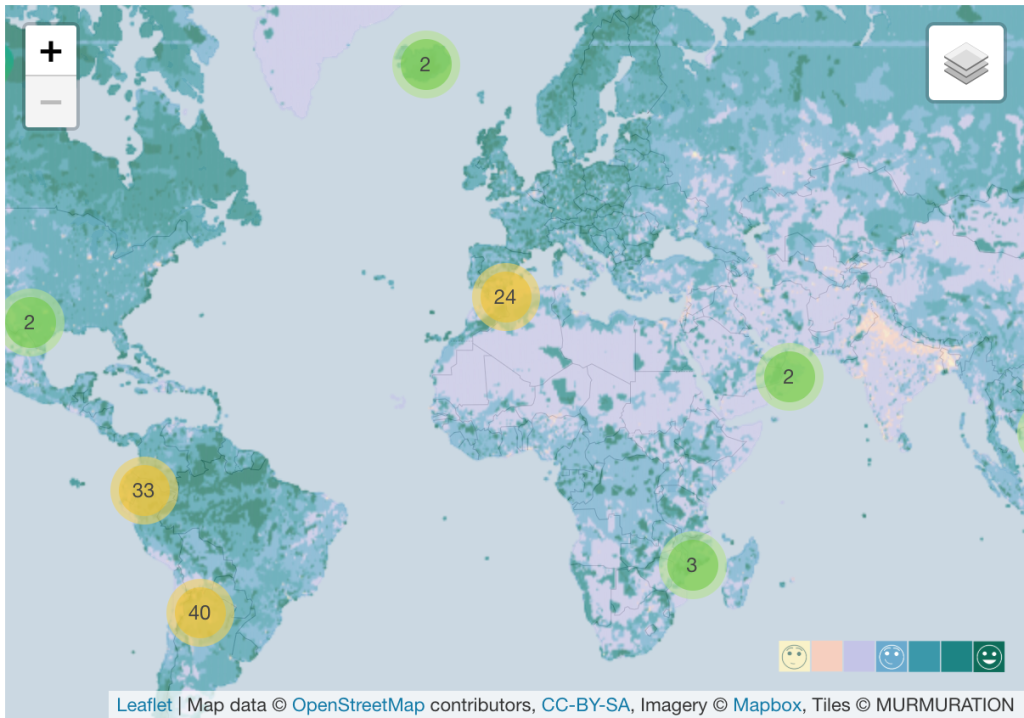
This inclusive approach is possible thanks to satellite data. Combined with various data from local authorities or even the general public (eg tourism statistics), it is possible to envisage large-scale sustainable tourism . The satellite data are factual and invaluable because they allow to go back in time, to identify the problems but also the solutions and to foresee future evolutions.
Through this platform, our desire is to create a global ecosystem that promotes sustainable practices through the linking of all stakeholders in tourism. Whether they are hotels, travel agencies, restaurants, guides, tourist offices, national parks, associations, they need to make themselves known and make their actions visible. These are choices that require significant investment. To highlight them in our platform is our primary mission so that they can devote their time and their budgets to concrete actions.
Sustainable tourism is associated with environmental issues, but not only. It brings together all aspects of sustainable development and also concerns corporate social responsibility. For a travel professional, it’s about maintaining a “spirit of the place” that values the geographical characteristics of a destination through its biodiversity, its cultural wealth, its heritage and the well-being of the inhabitants of the place.
Copyright image ImaginEarth
MURMURATION SAS is currently working on the FLOCKEO web platform to offer travelers and travel professionals a map of the world to know the environmental impact on destinations.

The FLOCKEO barometer uses 3 essential indicators that combined satellite data with other data to evaluate the ecological footprint on tourist destinations.
The International Union for the Conservation of Nature (IUCN) is one of the world’s leading organizations dedicated to the protection and preservation of nature. The FLOCKEO barometer takes into account data from protection programs at international, national and / or regional level and also the quality controls to ensure their effectiveness.
Satellite data combined with other data sources can be used to estimate the risks related to water. The FLOCKEO barometer takes into account the quantity, the quality, as well as the existence and the relevance of the infrastructures for a better management of water around the world.
The indicator makes it possible to specify low density areas as well as very dense urban areas by combining several data, including satellite data. The FLOCKEO barometer thus guides travelers to more or less dense urban areas and creates their own “green” journey.
D-3 before the official release of the FLOCKEO website
While the Global Climate Strike has begun these days around the world, we are looking at MURMURATION SAS for the growing impact of two crucial and social issues in terms of overtourism – which can be found through the case study from BALI.
Overtourism has become a crucial issue for the tourism sector. Moreover,, the effects of climate change have major issues, caused by humans and that directly affect our daily lives and the future.
We propose to counter the challenge of overtourism through the use of satellite data. Take the example of Indonesia: How a study on environmental impact could help to change the tourism sector in Bali
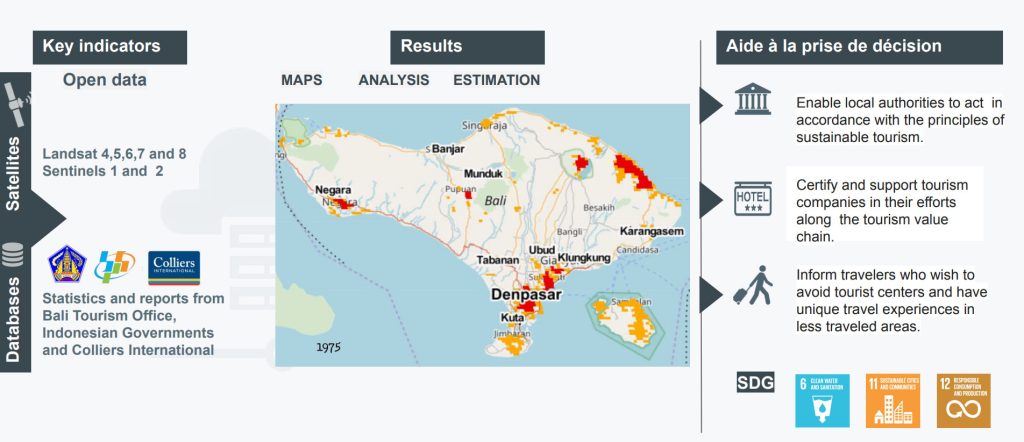
Bali is an Indonesian island famous for its wooded volcanic mountains, rice paddies, beaches and coral reefs. Unfortunately, it suffers from overtourism especially south of the island. Buildings are accelerating at the expense of nature and local life. and the lively tourist coasts do not benefit as much as locals in terms of economic development. the lively tourist coasts do not benefit as much as the locals in terms of economic development.

The map above gives some pointers to favor sustainable tourism, a true vector of love and peace between cultures.
The small town of Munduk offers to explore the inner region of Bali. The inhabitants of Munduk are less accustomed to crossing tourists but he remains very enthusiastic to meet and exchange with foreigners. The nature around Munduk allows beautiful breakaways. Many hiking trails start from Munduk and the surrounding hills soon become accessible. There are great walks in the forest with beautiful waterfalls and breathtaking views of rice terraces to the west of the city. Small Indonesian restaurants called “warung”, very simple and cheap, allow Indonesians and tourists to enjoy the local gastronomy. The traveler becomes an active player in his journey by choosing to go where his presence will be a source of meetings and sharing. The map above would avoid the mistakes made in the past and propose a sustainable tourism management taking into account the water needs, the establishment of the infrastructures necessary for the accommodation, and also the management of waste and transport for the benefit of local residents as well.
Indonesia is the third tropical forest in the world, even more threatened than the Amazon and regularly ravaged by the flames. Every minute is an area equivalent to six football pitches that is deforested according to the magazine Geo. The West Bali National Park is an example of preservation: 160 species of birds have been listed in the park, including the virtually extinct Bali Starling (Leucopsar rothschildi), the only endemic vertebrate species in Bali, the icon of wildlife. Bali. This is the main reason why this national park was created in 1941. In 2001, it was estimated that only six starlings would have survived in the wild, all in this park. Since then, captive breeding and reintroduction efforts have continued at a steady pace, but poaching pressures remain a major problem. With this in mind, a second reintroduction program was launched in the remote areas of Nusa Penida off Sanur Beach in 2004.
The term “Murmuration” describes the phenomenon by which starlings gather spontaneously in the air to face a predator. Faced with the exponential growth of mass tourism and its negative effects on the environment, MURMURATION SAS’s approach is similar: to create an ecosystem of engaged actors from the tourist sector to quantify the environmental pressure on popular destinations and to limit its impacts in the context of climate change. It aims to create better conditions for the development of a sustainable tourism!
October 2018, the Philippines reopen Boracay, a paradise island previously soiled by mass tourism. December 2018, the famous Thai island Koh Phi Phi lacks water because of the number of tourists. April 2019, Dubrovnik tries to manage the overtourism. June 2019, deaths on the slopes of Everest increase because of overtourism …
Many stories like those ones demonstrate the effects of mass tourism. Over-frequentation? Bad tourism management? In any case, prevention is better than cure. While tourism accounts for 8% of global greenhouse gas emissions (according to the Allenvi 2019 study), it is also a socio-economic catalyst and a factor in preserving the environment through the development of new trends such as sustainable tourism.
All the stakeholders have to help safeguard the places that make us dream during our travels. Tourists, tourism professionals, local authorities, associations and NGOs, governments, … All must collaborate so that the tourism activity can be a real promise of economic and social development, while preserving biodiversity and local life in a sustainable way.
Study case : Bali, a tourism booming. How to deal with environmental pressure?
This inclusive approach is possible thanks to satellite data. Combined with various data from local authorities or even the tourists (eg tourism statistics), this innovative solution aims to set up environmental pressure indicators on a global scale. Indeed, the observation of a dedicated area thanks to high-resolution satellite data allows to give reliable and transparent indicators. The satellite data are factual and invaluable because they allow to go back in time, to identify the problems but also the solutions and to foresee future evolutions.
Copyright image : rawpixel de Pixabay
What is essential in your growth strategy and sustainable development? Spatial data
(more…)The attractiveness of natural and touristic areas with a rich biodiversity is a major concern in the definition of sustainable management of tourist areas. These natural areas are much more sensitive to the tourist pressure induced by the increasing number of roads, an increasing urbanization and a growing number of travelers to host, guide, restore, etc. Natural ecosystems are the first victims of overcrowding in areas that were previously difficult to access. Excessive crossing on natural paths causes significant damage to vegetation, soil and water quality. The local populations are faced with financial issues such that for most of them, they leave their craft and agricultural activities and they devote themselves totally to the tourism activity, becoming totally dependant on it.
It is the responsibility of all actors to help safeguard naturals and touristic areas : tourists, tourism professionals, local officials, associations and NGOs. Everyone must work together to put in place environmental management that is conducive to both the economic and social development of these residents. Tourism activity can be a real promise of economic and social development, while preserving biodiversity in a sustainable way. Travel, within the framework of a sustainable tourism, is an encounter with a country and the complexity of its history, its cultures, its cults, its biodiversity, its ecosystems, it’s about Life and Earth.
Our emerging collaboration with Julien Leroy, founder of Terra Nordeste, is inscribed in this context. Julien describes his activity as a “craftsman of the journey”, he furrowed for almost 15 years the most beautiful natural places of Brazil. He literally fell in love with this country. He describes those places as of a wild and catchy beauty, but they are also very fragile and threatened: “I try to propose the most authentic and the most respectful trip possible of the country. I will soon collaborate with the Toulouse company “Murmuration”. It will provide me with satellite data so that I can visualize the impact of tourism in the regions where I work. It will allow me to act accordingly. ” Interview with Julien Leroy, Founder of Terra Nordeste.
Some solutions exist, one of them is to integrate satellite data into a collaborative approach to observe a dedicated area based on reliable data and difficult to contradict. The satellite allow us to go back in time, identify problems but also solutions and predict future developments. They are valuable and factual.
Copyright credit illustration ESA
Going a few thousand miles and sipping fresh fruit juices in an exotic setting and on a hot, humid afternoon is no longer the preserve of just a few elites. The trip is democratized, it allows a greater openness to the world, to meet the other, change his habits, discover new places, admire the diverse nature around the world. The unparalleled pleasure of facing beautiful landscapes unfortunately and often has a negative impact on the environment. Several initiatives are being implemented at various scales: ecotourism, outdoors, river tourism, bicycle tourism, sustainable tourism.
We wanted to answer the following question: How to understand our impact and help reduce it?
In this case study, we will demonstrate how to quantify its impact in order to implement the necessary measures at the scale of a tourist region : Bali, an Indonesian island famous for its wooded volcanic mountains, rice paddies, beaches and coral reefs.
Speaking at German trade show ITB in Berlin Dr. Stroma Cole, director of Equality in Tourism highlighted that it is the sustainable management of water that will be the major vector of driving tourism in the coming years. She also mentioned that Bali will be facing a critical point at 2020 concerning the water supply and demand. This conclusion is based on the findings of several monitoring organisations, for example the Bali Hotel Association (BHA) and Howarth HTL where they report that the assumed per capita daily use of fresh water is of 183 liters, whereas for a 2 stars hotel the consumption is of 1000 liters. Knowing that lots of hotels are 2+ stars in Bali, the water consumption ratio is likely to be more than 1 to 5. For statistics concerning the number of hotels and their ratings please refer to this document.
We started to look for the available open and free data to see if this makes any sense at all.
The first dataset We looked for was statistics on the number of travellers flying to Bali to see how these fluctuated over the past decade. I found an open dataset (here) coming from the Indonesian government that showed a continuous increase in the number of tourists climbing from 2 millions to approximately 11 million visiting tourists in 2014. Moreover the data showed the number of tourists who checked-in the different attraction over the beautiful island.
The most visited region of Bali in 2014 was the south west region of Tabanan that accounts for about 40% of all tourists.

The following map shows the relative weight of each region in the constant growth of tourists.

As you can see, the region that have seen a significant increase in the number of tourists is the region situated at the south and center of the island. The sandy beaches of Kuta, the temple of Tanah Lot are major attractions in Bali. One may think that given the small size of the island, tourists have the choice of staying in the north or the center for example and visit these areas on day tours. This would mean that the increase of residential areas in these regions can be reasonable to avoid putting major stress on the infrastructures through the creation of hotels for example. Trying to identify patterns of growth of residential areas is something that earth observation data by satellites does great thanks to the global coverage and the diversity of sensors.