The quality of air around the world is deteriorating, it is a well-known fact, and still too few people acknowledge it as the need of the hour. This article explains how Murmuration contributes in helping to combat this issue. Murmuration is a French SME created in March 2019 with the aim of introducing the environmental dimension into the decision-making cycle, focusing on tourism management institutions and stakeholders. We are using mainly earth observation satellite data, mixed with in-situ and socio-economic data.
Murmuration has developed ready-to-use indicators based on the prior mentioned data sources. Among them, the air quality indicator aims to provide insights on the evolution of major air pollutants across the globe for comparison and evaluation purposes. The indicator follows standards for data production and dissemination, such as the Open Geospatial Consortium (OGC) standards. It makes it ready to use for most of the client applications. The main objective is to help policymakers and other stakeholders identify problems at their root so that actions can be made accordingly.
The quality of air has been deteriorating since the beginning of the industrial revolution. Toxicity of the air is higher than ever before. In order to control it, it has to be monitored systematically. To do so, the World Health Organization started to establish Air Quality guidelines in 1987 to define safe levels of the air pollutants. The latest revision published in September 2021 defines six compounds as the primary air pollutants because of their significant effect on human health. It includes 4 gases (NO2, SO2, CO and O3) and 2 dust particles (PM2.5 and PM10). Each of these compounds affect human health in several different ways.
Through its air quality indicator, Murmuration aims at helping even non-experts understand the situation. The indicator studies air pollution at the level of individual compounds as well as an aggregated score including all pollutants.
The nature of the indicator and the algorithms used are explained in the following sections. The data used for computing the indicator comes from the TROPOMI instrument of the Sentinel 5P satellite.
But why using satellite data when air pollution has been monitored using ground sensors for a long time? The conventionally existing measurements based on in-situ sensors are very local to the region of measurement (say 50 m). This cannot be used to monitor the whole city unless these in-situ sensors are installed in every place in the city. But, it is a very costly process and has to be maintained consistently.
This is the place where satellite data comes to play. Even though there is a tradeoff with the spatial resolution, the data helps studying the air quality at the city level. Satellites monitor air quality at a much cheaper cost, in a scalable way (once launched and flying, it can monitor many cities with no additional cost) and are producing measurements that can be compared from one city to another making it a very good tool for evaluating and benchmarking cities with each other.
Sentinel 5P is the first sentinel satellite to monitor the atmospheric composition. The instrument measures solar light in the ultraviolet and visible, near-infrared and shortwave infrared spectral bands. The light is split into different wavelengths using a grating spectrometer and they are captured accordingly by four different detectors to measure the level of different compounds.
The raw data from Sentinel 5P is then processed, validated, georeferenced and made available for ease of access through Copernicus Atmosphere Monitoring Service (CAMS). The processed and validated data for all of the 6 above mentioned compounds are used to calculate the indicator. The 6 individual compounds are available every day at an hourly level. Daily levels are then computed with aggregation algorithms reflecting the health impact (short term or long-term ) of each pollutant (based on WHO guidelines). The aggregated data is then fed over a data transformation pipeline to be converted to the desired format.
The aggregated air quality indices are calculated at 2 different temporal levels – yearly and daily. Two different algorithms are used to arrive at the indices :
The indexes are defined at two different coverages – European and Global. This is the result of availability of raw data of Global coverage at 0.1 ° (appx. 100 km near the equator) spatial resolution and raw data of European coverage at 0.01 ° (appx. 10 km near the equator) spatial resolution. The raw data for European coverage are readily available as mass concentration in µg/m3 which is the standard used by WHO to evaluate air quality levels. On the contrary, the raw data for global coverage is not readily available in the standard format.
In the global coverage data, dust particles such as PM10 and PM2.5 are available as mass concentrations in kg/m3 which can be converted using a conversion factor. But the gases like NO2, SO2, CO and O3 are available in mass mixing ratio in kg kg-1. They have to be converted to mass concentrations using ideal gas equations. Finally, all the gases and dusts are available in mass concentrations with the same unit µg/m3.
At the end, Murmuration’s Air Quality Indicator can be used from 2 channels that Murmuration is providing:
While the map service takes care of studying the distribution of various compounds and its hotspots, the programmatic interface helps in narrowing the study to any particular area of interest and to study the change over a temporal scale.
The indicator helps in identifying problems such as pointing out regions or times of high pollution or temporal range of high pollution exposure. The World Health Organization estimates that air pollution causes 7 million premature deaths per year. This is one of the biggest environmental threats to human life. By finding out regions of concern, appropriate actions and measures can be taken by government bodies, enterprises and non-governmental organizations to mitigate the situation.
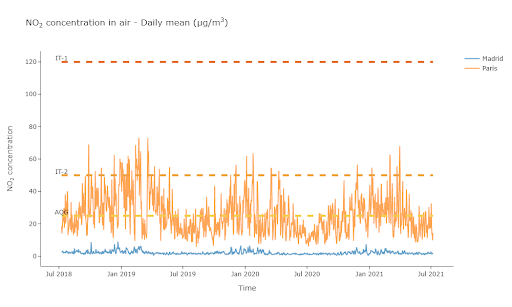
(Graph of NO2 concentration in the air in Paris and Madrid, ©Murmuration)
The above chart shows the Murmuration NO2 indicator and its evolution in Madrid and Paris over a three-year time frame.
Thanks to the indicator developed by Murmuration, it is possible to study the air quality level at the city level in a cost-effective manner. Monitoring air quality using satellite measurements will not completely replace the in-situ measurements. They act complementary to each other. While satellite measurements help in monitoring air quality at city level or higher, in-situ measurements help in monitoring air quality at street or neighborhood level (hospitals, schools, parks etc.).
This article is one among many that will be published until the end of March, explaining what Murmuration’s indicators are and their purposes.
Author : Murugesh MANTHIRAMOORTHI, Remi NASSIRI
The IUCN (International Union for Conservation of Nature) stated that “plastic pollution is the most widespread problem affecting the marine environment”. Most of this pollution ends in the plastic oceans.
Plastics take centuries to degrade and contaminate the entire food chain. Each year, up to 13 million tons of plastic end up in the oceans because it is not recycled. Current estimates indicate that there is about 150 million tons of plastic found in the ocean. In 2018, the UN environment program placed the issue of plastic in the ocean among the six environmental emergencies of greatest concern.
Active methods of plastic removal are required to address this issue. Being able to detect and track plastic litters is crucial to enable these methods. There are three main approaches to track them: numerical modelling, in situ observation and earth observation satellite images.
Most of ocean plastic comes from rivers. Knowing the main points of origin and using data on ocean currents and on vertical mixing of water layers, it is possible to model the probable trajectory of plastic litter and the areas where they will stagnate and concentrate. The Copernicus Marine Service provides ocean current models that are used for this purpose.
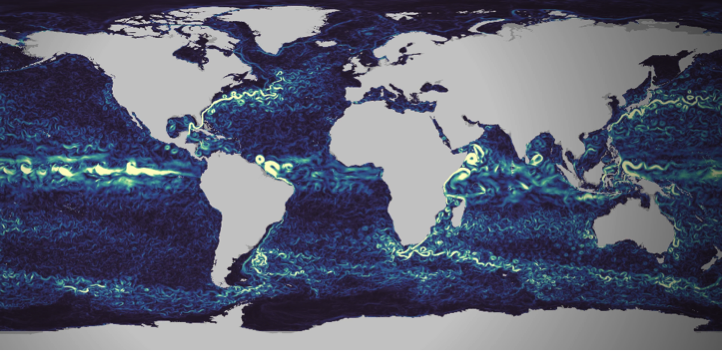
Figure 1 : Visualization of Copernicus Marine currents numerical models, extracted from https://myoceanlearn.marine.copernicus.eu/
Local measurements are regularly performed to understand and quantify the issue’s importance. With statistical processing of the collected data, these measurements campaigns allow to build and calibrate the plastic litter tracking models (see for instance van Sebille et al.).
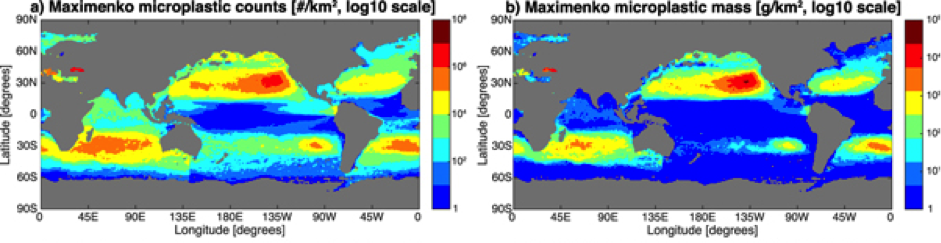
Figure 2 : Maps of microplastic count (left column) and mass (right column) distribution for one of the studied statistical models, extracted from the work of Van Sebille et al.
99% of ocean plastic lays at the bottom of oceans, whereas only 1% floats on the surface. Remote sensing from space therefore suffers from a structural limitation that will never make it a self-sufficient solution to the problem. However, with their ability to cover large et inaccessible areas, using satellite images is an innovative approach that can complement modelling and in-situ observation. While still at the research and development stage, many research groups carry out experiments. They have to work with the tools at their disposal, which are not initially designed for this task.
The European Earth Observation Copernicus program offers different options here. First is the satellite Sentinel 3, dedicated to ocean observation. It is though designed to monitor large-scale oceanic processes. Its 300 meters resolution does not make it an adequate tool for plastic monitoring.
The Sentinel-2 satellite is an interesting alternative. It provides images in the visible part of the spectrum with a 10 to 20 meters resolution. Small pieces of plastic are not noticeable. However when they aggregate into large clusters they become more likely to be detected by satellites with such spatial resolution.
Sentinel-2 has been studied as a solution to ocean plastic monitoring by many research groups (see the work performed by a group from 25 different institutions, or this work carried out by a group from the Plymouth Marine Lab in 2019). However It has been initially designed for land monitoring. While its orbit covers all the earth, images are not collected on the wide open ocean areas. Images are only available on continental coastal areas and around islands. It is still though a very interested approach showing interested results in the covered areas.
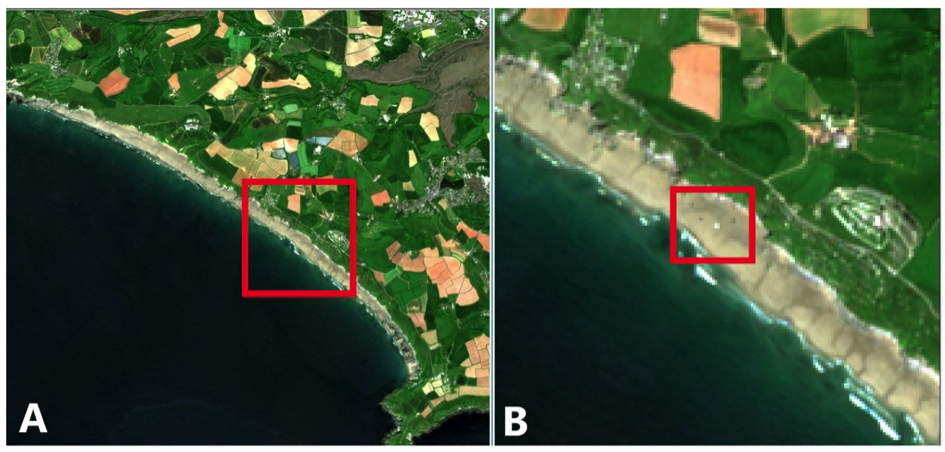
Figure 3 :Example of plastic detection on a coastal are using Sentinel-2 images. Extracted from the work of the Plymouth Marine Laboratory
Earth observation satellite programmes mainly focus on land. Coverage of the oceans is limited to the observation of global phenomena, with a relatively low resolution (~300m).
Higher resolution observations are available over coastal areas.
However, most plastic waste is deposited on the ocean floor. It is therefore not observable by satellites. Those that remain on the surface can accumulate in clusters visible from space.
Observation from space should be considered as a complementary solution. It can be used to detect plastic waste in coastal areas before it is dumped.
Earth observation is thus a useful data source for flow analysis and waste tracking models. It provides a wide and systematic spatial coverage that ideally complements the more accurate but local and punctual in-situ observations.
Finally, it is important not to stop thinking about the role of space observation in ocean pollution control. Indeed, satellites are evolving, and so are observation tools. Improved resolution could allow for more detailed observation of plastic waste in the oceans. Going from 300 m resolution to 20 m with global coverage of the oceans would be a major advance. This would make it possible to position space observation at the centre of the tools and means for sustainable action in the oceans.
Setting up this type of mission takes time, but the plastic crisis in the oceans could lead space observation down this path.
Authors : Fabien Castel, Rémi Nassiri
The Flockeo platform proposes an innovative approach : Travelers become their own guides by choosing sustainable destinations!
Our approach is inspired by the European Commission’s ETIS indicator system , developed to assess the sustainability of tourism destinations. By combining satellite and statistical data, the Flockeo indicator measures the pressure of human activities on the environment. Thanks to an interactive map, users can zoom in on the destinations that interest them and know the index of the region concerned. Through a colors rating, they will be able to easily assess the impact of human activities through four criteria: the ecosystem potential, the risks related to water and the urbanization processes.
This inclusive approach is possible thanks to satellite data. Combined with various data from local authorities or even the general public (eg tourism statistics), it is possible to envisage large-scale sustainable tourism . The satellite data are factual and invaluable because they allow to go back in time, to identify the problems but also the solutions and to foresee future evolutions.
Through this platform, our desire is to create a global ecosystem that promotes sustainable practices through the linking of all stakeholders in tourism. Whether they are hotels, travel agencies, restaurants, guides, tourist offices, national parks, associations, they need to make themselves known and make their actions visible. These are choices that require significant investment. To highlight them in our platform is our primary mission so that they can devote their time and their budgets to concrete actions.
Sustainable tourism is associated with environmental issues, but not only. It brings together all aspects of sustainable development and also concerns corporate social responsibility. For a travel professional, it’s about maintaining a “spirit of the place” that values the geographical characteristics of a destination through its biodiversity, its cultural wealth, its heritage and the well-being of the inhabitants of the place.
MURMURATION SAS joins ESA BIC Sud France, whose mission is to support the creation of companies and start-ups linked to the space sector. ESA BIC Sud France is one of the 22 incubators of the European Space Agency. Covering the Occitania-Pyrenees / Mediterranean, New Aquitaine, PACA and AuvergneRhône-Alpes regions, ESA BIC Sud France has supported, since its creation in 2013, more than 75 companies.
Space travel is not the only way to bring together “space” and “tourism”. Space can already be a powerful tool in developing appropriate strategies to fight the effects of over-tourism and to assess the environmental impact on tourist destinations.
MURMURATION SAS aims to provide B2B and consulting services for the tourism sector, including a web platform based on earth observation satellite data, Flockeo.
Combining various datasets ranging from public official tourism statistics to proprietary data, it is possible to set up environmental pressure indicators on a global scale. Indeed, the observation of a specific area using satellite data makes it possible to give reliable and transparent measures and actionable data. The satellite data is of great value, as it enables time-travel to the past to assess the situation, provide solutions and to foresee future evolutions.
The term “Murmuration” describes the phenomenon by which starlings gather spontaneously in the sky to face a potential predator.
Faced with the exponential growth of mass tourism and its negative effects on the environment, MURMURATION SAS’s approach is similar: to create an ecosystem of engaged actors in the world of tourism to better measure the environmental pressure on popular destinations and to limit its impacts, in the context of proven climate disruption. It’s all about creating the conditions for the development of sustainable and reasoned tourism!
Study the environmental impact of tourist sites,
Raise the community’s awareness to sustainable tourism
Enhance the community commitment to social and environmental actions
Copyright image ImaginEarth
MURMURATION SAS is currently working on the FLOCKEO web platform to offer travelers and travel professionals a map of the world to know the environmental impact on destinations.

The FLOCKEO barometer uses 3 essential indicators that combined satellite data with other data to evaluate the ecological footprint on tourist destinations.
The International Union for the Conservation of Nature (IUCN) is one of the world’s leading organizations dedicated to the protection and preservation of nature. The FLOCKEO barometer takes into account data from protection programs at international, national and / or regional level and also the quality controls to ensure their effectiveness.
Satellite data combined with other data sources can be used to estimate the risks related to water. The FLOCKEO barometer takes into account the quantity, the quality, as well as the existence and the relevance of the infrastructures for a better management of water around the world.
The indicator makes it possible to specify low density areas as well as very dense urban areas by combining several data, including satellite data. The FLOCKEO barometer thus guides travelers to more or less dense urban areas and creates their own “green” journey.
D-3 before the official release of the FLOCKEO website
Satellite images are a powerful tool for Earth observation and monitoring sensitive areas. As part of the Copernicus program and mandated by the European Commission, ESA (European Space Agency) has implemented the Sentinel satellites, the guards of the planet. Thanks to this program, we could detect hydrocarbon pollution at large of the Brazilian coasts and provide evidence for local authorities to help uncover the origin of this major disaster.
At MURMURATION, we confirm the catastrophic situation that these Brazilian coasts are currently experiencing. As shown in the following Sentinel images, we are able to detect oil pollution off the Brazilian coasts in the east, in the state of Bahia.
Oil slicks are observed spanning over 20km, which corresponds to 800 Tennis courts!
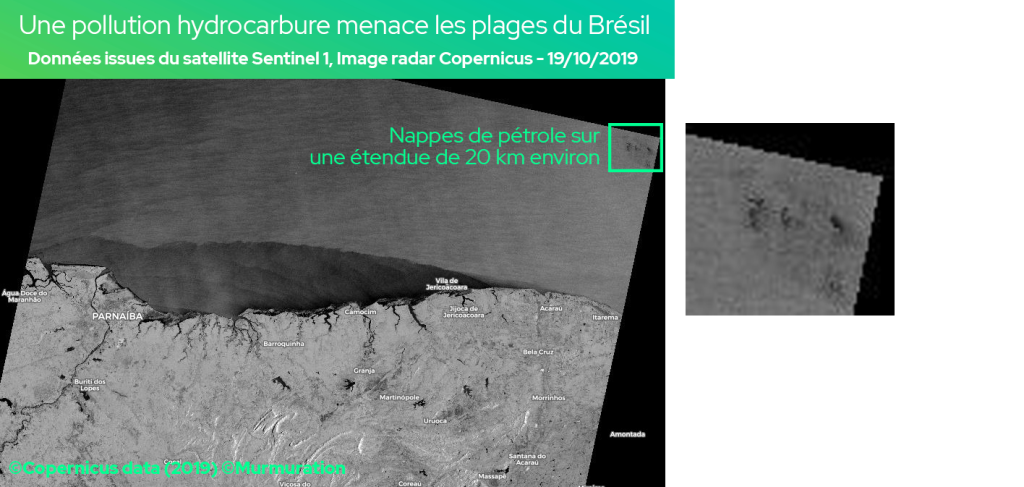
The Sentinel 1 radar images of the Copernicus program provide all-weather imagery (passing through cloud cover) thus enabling the handling of emergency situations (natural or industrial disasters) and environmental monitoring (sea ice, glaciers, water extents, landslide, and so on).
An extent of about 10 km of oil slicks was observed off Açu de Torre … which corresponds to nearly 400 tennis courts!
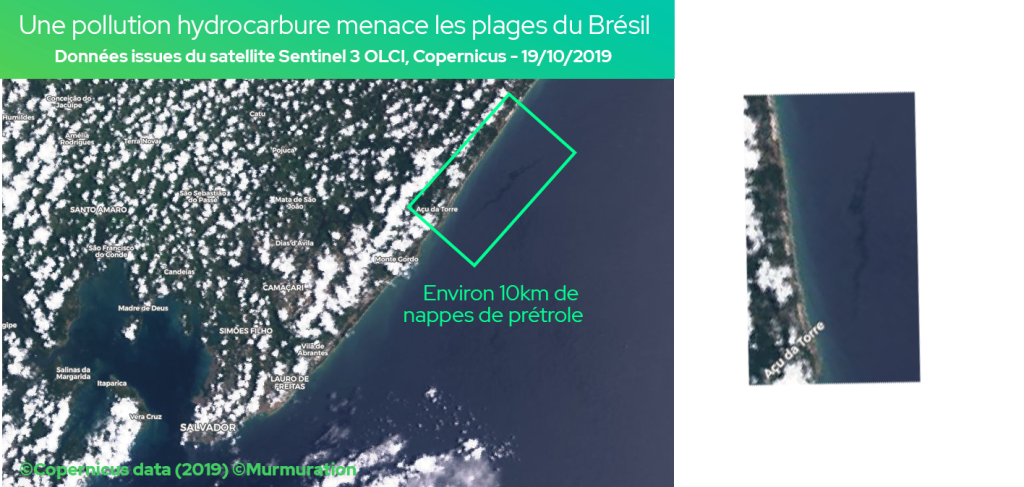
Sentinel 3 OLCI satellite images (Ocean and Land Color Instrument) allow measuring the state of the oceans and coastal zones (pollution, current …) thanks to color levels (spectral bands).
The Brazilian oil spill is an unprecedented ecological disaster with a short, medium and long-term impacts on the natural ecosystems and the economy of the country. Marine ecosystems are becoming stagnant while the country’s economy can be affected. Brazilian beaches, reputed for their beauty and attracting tourists from all over the world, may be deserted by travelers. The tourism sector is already heavily impacted by the situation ! But the worst is yet to come : Cleaning is almost impossible under current conditions.
O óleo no Nordeste e a destruição da Amazônia mostram as consequências do desmonte ambiental promovido pelo governo, prejudicando a imagem do país. Os impactos são gravíssimos para os oceanos, a Amazônia e a vida das pessoas. https://t.co/1PR9Rh6a1B #InimigoDoMeioAmbiente pic.twitter.com/sfZd2MxEla
— Greenpeace Brasil (@GreenpeaceBR) October 23, 2019
The tourism sector is undergoing a major digital transformation. The web and social media have fundamentally changed the way companies do business and the way people connect with each other. It is not only a technological evolution but a social transition that operates through the web technologies. Traveling is one of the activities that we do in order to change our relationship to the world and discovering new perspectives. It is also one of the most important economic sectors : tourism represents 10% of world GDP.
Users who create their own travel content are now the primary reference sources for travel information. Nearly 2.4 billion people use a smartphone in 2017, an increase of 10.8%.
1/3 of the world’s population has adopted mobile phone use which has significantly increased the amount and type of user-generated content, including in the tourism sector.
Many social media channels have been launched during the past decade, Instagram, Pinterest, SinaWeibo and Snapchat to name a few. These platforms have implemented features that allow users to include the name and geographic coordinates of their locations and the trips they make.
A major turning point in the sharing of experience, it is now in real time and can have immediate consequences on tourist destinations. 22% of travelers use the contents of their relatives to choose their future destination.
According to “Think with Google”, 85% of travelers decide activities only after arriving at their destination. The democratization of the media has lowered costs and technical barriers in marketing and communication. This offers new opportunities for low-income countries or smaller players in tourism. They can develop their presence on the web, use new data sources and communicate directly with travelers
All these figures lead us to ask the following question: what tourism do we want for tomorrow?
The term “Murmuration” describes the phenomenon by which starlings gather spontaneously in the air to face a predator. Faced with the exponential growth of mass tourism and its negative effects on the environment, MURMURATION SAS’s approach is similar: to create an ecosystem of engaged actors from the tourist sector to quantify the environmental pressure on popular destinations and to limit its impacts in the context of climate change. It aims to create better conditions for the development of a sustainable tourism!
October 2018, the Philippines reopen Boracay, a paradise island previously soiled by mass tourism. December 2018, the famous Thai island Koh Phi Phi lacks water because of the number of tourists. April 2019, Dubrovnik tries to manage the overtourism. June 2019, deaths on the slopes of Everest increase because of overtourism …
Many stories like those ones demonstrate the effects of mass tourism. Over-frequentation? Bad tourism management? In any case, prevention is better than cure. While tourism accounts for 8% of global greenhouse gas emissions (according to the Allenvi 2019 study), it is also a socio-economic catalyst and a factor in preserving the environment through the development of new trends such as sustainable tourism.
All the stakeholders have to help safeguard the places that make us dream during our travels. Tourists, tourism professionals, local authorities, associations and NGOs, governments, … All must collaborate so that the tourism activity can be a real promise of economic and social development, while preserving biodiversity and local life in a sustainable way.
Study case : Bali, a tourism booming. How to deal with environmental pressure?
This inclusive approach is possible thanks to satellite data. Combined with various data from local authorities or even the tourists (eg tourism statistics), this innovative solution aims to set up environmental pressure indicators on a global scale. Indeed, the observation of a dedicated area thanks to high-resolution satellite data allows to give reliable and transparent indicators. The satellite data are factual and invaluable because they allow to go back in time, to identify the problems but also the solutions and to foresee future evolutions.
Copyright image : rawpixel de Pixabay
What is essential in your growth strategy and sustainable development? Spatial data
(more…)