Murmuration is pleased to announce its selection as the French organizer of the 3rd Cassini Hackathon, a European Union programme.
To achieve this, we have partnered with Open Tourisme Lab based in Nîmes, who bring their expertise in supporting entrepreneurs and start-ups.
This 3rd edition of the Hackathon will be on the theme of (Re)Vitalizing Tourism in Europe. It will highlight the use of technologies and spatial tools to innovate and revitalize the tourism industry in Europe in a responsible way.
To achieve this, 3 challenges have been identified: Finding sustainable destinations; Experiencing cities and cultures; Caring for our wildlife.
These challenges are aimed at students, entrepreneurs, or anyone with the desire to innovate and act sustainably.
It is therefore with pleasure that we announce that the CASSINI Hackathon will take place from 12 to 14 May 2020 in Nîmes.
Big cities keep on growing, it is important to monitor this development process, and that’s why Murmuration created its own Urbanisation Indicator. As a result of technological progress, humanity is constantly expanding its urban territory. This phenomenon of urbanization leads to an artificialization of the soil and poses three major problems:
Nowadays, three solutions exist to answer these problems :
Murmuration proposes an Urbanization indicator, built from satellite data. Today, a city or a village is quite capable of determining the evolution of its urbanization without using spatial data. However, it is at a more global scale that the task becomes more complex. Indeed, for a region or a country to be able to calculate the evolution of its urbanization, it would be necessary for all the sub-communities to gather their data together.
The Urbanization indicator is an observation tool that allows the visualization of land artificialisation in a given area of the world at a given time. It also allows to study its evolution between two years. To better understand how it works, here are two images.
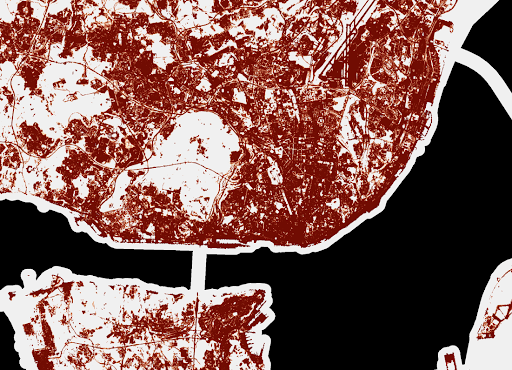
(Urbanism map of Lisbon, 2018, ©Murmuration)
This is an image representing the density of land taking process in Lisbon in 2018.The accuracy is 10 meters. The density is calculated as a percentage. The darker the area is red, the higher the density of land taking process. Conversely, the lower the density of an area, the more it will be represented in light red, until it becomes white if the area is not artificialized.
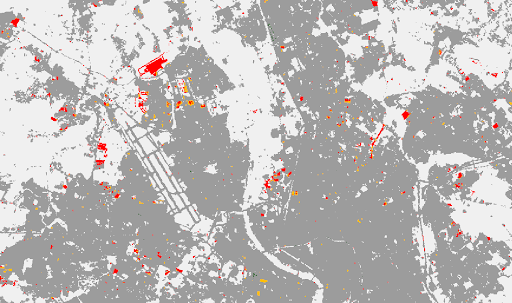
(Evolution of land artificialisation in Toulouse between 2015 and 2018, ©Murmuration)
Finally, this image represents the evolution of land artificialisation of a part of the city of Toulouse between 2015 and 2018. The accuracy is 20 meters. the areas in dark gray t have not evolved between the two periods. In red and yellow, are the areas where we built. In green, these are the areas where the artificialization has decreased (creation of park, destruction of building, …). Finally, in white, these are the undeveloped areas.
To operate, the indicator uses three different databases. The first is from the Wekeo service. This company offers Copernicus data for free download, including all Sentinel satellite data, contributing missions and Copernicus marine, terrestrial, atmospheric and climate services. We can find the data of soil impermeability in Europe with a precision varying between 10 and 100 meters depending on the selected options. These data are present every 3 years, from 2006 to 2018 and are accompanied by data showing their evolution over the same period.
However, this service only offers soil impermeability data in Europe. This is why we use a second database from the Copernicus Global Land Service. This organization offers data displaying the built-up areas in the world, from 2015 to 2019, with a precision of 100 meters. We can then calculate ourselves the evolution of these areas between each year.
Finally, for the most recent years and for a worldwide observation, the database from the World Cover service is used. WorldCover provides a new reference product for global land cover at 10m resolution for 2020, based on Sentinel-1 and 2 data that have been developed and validated in near real time and at the same time maximize the impact and usability for end users.
To better understand the usefulness of such an indicator, let’s see how we can study the evolution of urbanization in Occitania in relation to the objective “Net Zero Artificialization” (NZA).
This objective in France aims at limiting the increase of the impermeability of the soils in order to reach a zero growth in 2050. Thanks to the urbanization indicator, we can see that the Occitanie region has experienced a growth of 3.4% between 2015 and 2018.
Even though such growth seems to show that the ZAN goal is not met, it should be understood that the region is one of the most attractive in the metropolis, with a population growth of 3.5% between 2013 and 2018 according to INSEE.
In order to evaluate the achievements of the Net Zero Artificialisation’s objectives, Urbanisation Indicator seems to be the most adequate. It allows a larger time and space analysis.
On the other hand, it can be seen that urban growth is difficult to compensate. When a natural area is artificialized, there is little chance that it will return to its original state.
Indeed, between 2012 and 2018 only 0.01% of the artificialized territory in Occitania has undergone a significant decrease in its imperviousness.
Finally, it is interesting to study the impact of major cities on the increase in net land artificialisation in Occitania between 2015 and 2018. Toulouse, which is the region’s capital, alone absorbs 8.2% of all urban growth while constituting only 4.87% of the urban area in Occitanie.
Montpellier, which is the second largest city in the region, absorbs 3.2% of all urban growth, while it only constitutes 2% of the urban area in the region. One might therefore think that the metropolises act as catalysts for soil artificialisation.
However, these are the same cities that have the highest density in the region and therefore limit urban expansion to a maximum. The large cities therefore have a double-edged impact on land artificialisation.
Thus, it is important that the city councils of these metropolises continue to develop their urbanization while applying the three methods for limiting the net artificialisation of land: avoid, limit and compensate.
The quality of air around the world is deteriorating, it is a well-known fact, and still too few people acknowledge it as the need of the hour. This article explains how Murmuration contributes in helping to combat this issue. Murmuration is a French SME created in March 2019 with the aim of introducing the environmental dimension into the decision-making cycle, focusing on tourism management institutions and stakeholders. We are using mainly earth observation satellite data, mixed with in-situ and socio-economic data.
Murmuration has developed ready-to-use indicators based on the prior mentioned data sources. Among them, the air quality indicator aims to provide insights on the evolution of major air pollutants across the globe for comparison and evaluation purposes. The indicator follows standards for data production and dissemination, such as the Open Geospatial Consortium (OGC) standards. It makes it ready to use for most of the client applications. The main objective is to help policymakers and other stakeholders identify problems at their root so that actions can be made accordingly.
The quality of air has been deteriorating since the beginning of the industrial revolution. Toxicity of the air is higher than ever before. In order to control it, it has to be monitored systematically. To do so, the World Health Organization started to establish Air Quality guidelines in 1987 to define safe levels of the air pollutants. The latest revision published in September 2021 defines six compounds as the primary air pollutants because of their significant effect on human health. It includes 4 gases (NO2, SO2, CO and O3) and 2 dust particles (PM2.5 and PM10). Each of these compounds affect human health in several different ways.
Through its air quality indicator, Murmuration aims at helping even non-experts understand the situation. The indicator studies air pollution at the level of individual compounds as well as an aggregated score including all pollutants.
The nature of the indicator and the algorithms used are explained in the following sections. The data used for computing the indicator comes from the TROPOMI instrument of the Sentinel 5P satellite.
But why using satellite data when air pollution has been monitored using ground sensors for a long time? The conventionally existing measurements based on in-situ sensors are very local to the region of measurement (say 50 m). This cannot be used to monitor the whole city unless these in-situ sensors are installed in every place in the city. But, it is a very costly process and has to be maintained consistently.
This is the place where satellite data comes to play. Even though there is a tradeoff with the spatial resolution, the data helps studying the air quality at the city level. Satellites monitor air quality at a much cheaper cost, in a scalable way (once launched and flying, it can monitor many cities with no additional cost) and are producing measurements that can be compared from one city to another making it a very good tool for evaluating and benchmarking cities with each other.
Sentinel 5P is the first sentinel satellite to monitor the atmospheric composition. The instrument measures solar light in the ultraviolet and visible, near-infrared and shortwave infrared spectral bands. The light is split into different wavelengths using a grating spectrometer and they are captured accordingly by four different detectors to measure the level of different compounds.
The raw data from Sentinel 5P is then processed, validated, georeferenced and made available for ease of access through Copernicus Atmosphere Monitoring Service (CAMS). The processed and validated data for all of the 6 above mentioned compounds are used to calculate the indicator. The 6 individual compounds are available every day at an hourly level. Daily levels are then computed with aggregation algorithms reflecting the health impact (short term or long-term ) of each pollutant (based on WHO guidelines). The aggregated data is then fed over a data transformation pipeline to be converted to the desired format.
The aggregated air quality indices are calculated at 2 different temporal levels – yearly and daily. Two different algorithms are used to arrive at the indices :
The indexes are defined at two different coverages – European and Global. This is the result of availability of raw data of Global coverage at 0.1 ° (appx. 100 km near the equator) spatial resolution and raw data of European coverage at 0.01 ° (appx. 10 km near the equator) spatial resolution. The raw data for European coverage are readily available as mass concentration in µg/m3 which is the standard used by WHO to evaluate air quality levels. On the contrary, the raw data for global coverage is not readily available in the standard format.
In the global coverage data, dust particles such as PM10 and PM2.5 are available as mass concentrations in kg/m3 which can be converted using a conversion factor. But the gases like NO2, SO2, CO and O3 are available in mass mixing ratio in kg kg-1. They have to be converted to mass concentrations using ideal gas equations. Finally, all the gases and dusts are available in mass concentrations with the same unit µg/m3.
At the end, Murmuration’s Air Quality Indicator can be used from 2 channels that Murmuration is providing:
While the map service takes care of studying the distribution of various compounds and its hotspots, the programmatic interface helps in narrowing the study to any particular area of interest and to study the change over a temporal scale.
The indicator helps in identifying problems such as pointing out regions or times of high pollution or temporal range of high pollution exposure. The World Health Organization estimates that air pollution causes 7 million premature deaths per year. This is one of the biggest environmental threats to human life. By finding out regions of concern, appropriate actions and measures can be taken by government bodies, enterprises and non-governmental organizations to mitigate the situation.
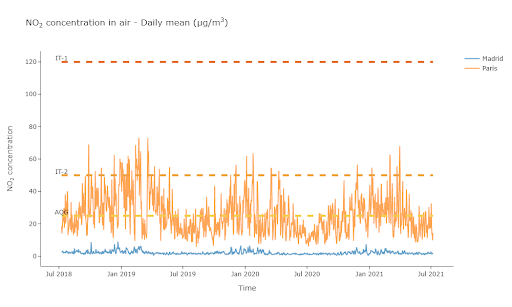
(Graph of NO2 concentration in the air in Paris and Madrid, ©Murmuration)
The above chart shows the Murmuration NO2 indicator and its evolution in Madrid and Paris over a three-year time frame.
Thanks to the indicator developed by Murmuration, it is possible to study the air quality level at the city level in a cost-effective manner. Monitoring air quality using satellite measurements will not completely replace the in-situ measurements. They act complementary to each other. While satellite measurements help in monitoring air quality at city level or higher, in-situ measurements help in monitoring air quality at street or neighborhood level (hospitals, schools, parks etc.).
This article is one among many that will be published until the end of March, explaining what Murmuration’s indicators are and their purposes.
Author : Murugesh MANTHIRAMOORTHI, Remi NASSIRI
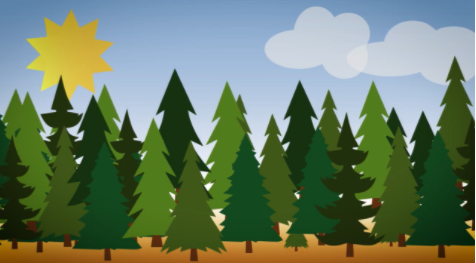
In metropolitan France, forests cover 31% of the territory, i.e. nearly 17 million hectares. The importance of vegetation cover as a lung for the animal kingdom is well known. But all over the world, these green treasures must meet the ecological and social challenges of tomorrow. In particular, to address climate change, strategies must be put in place for the sustainable management of forest ecosystems and the maintenance of forest health.
In February 2021, in France, a petition was launched to stop the cutting of trees in the forests of the Sénart region. The movement is gaining momentum, and the NOF (National Office of Forests) must explain the management of vegetated areas and their sustainability
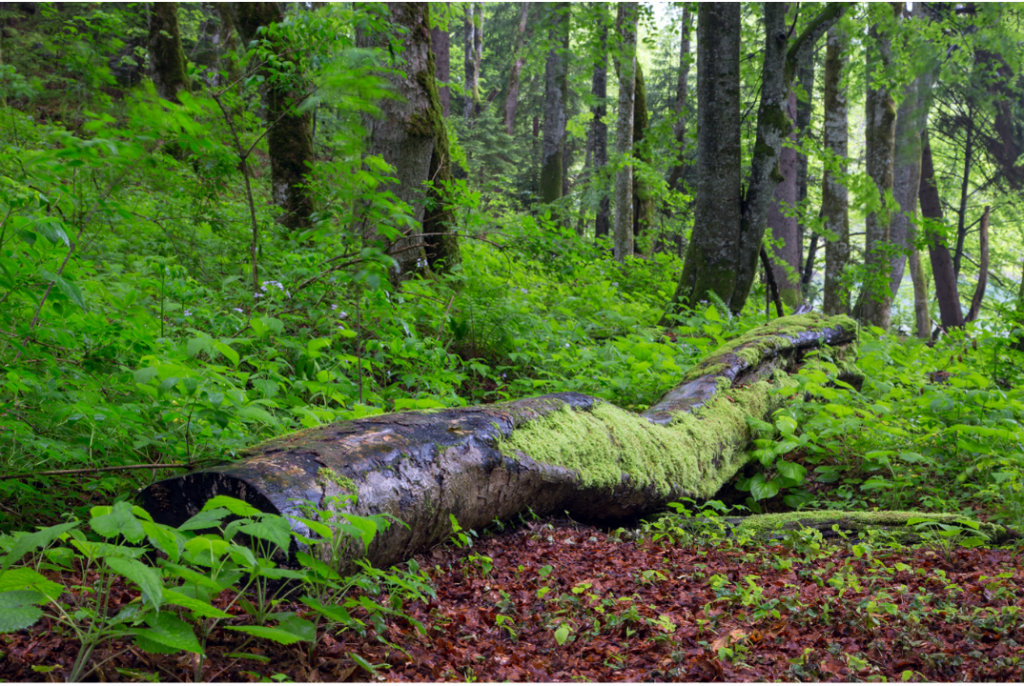
(Forest, ©Canva)
This article aims to provide a better understanding of this problem and the issues at stake. It also shows the role that technological and scientific progress can play in better understanding the causes and consequences of forest health degradation in threatened regions.
The concept of a healthy forest has universal appeal. However, forest ecologists and managers are struggling to define this concept exactly. Thus, to date, there is no universally accepted definition for forest health.
Most definitions of forest health can be classified according to their ecological or utilitarian perspective. From an ecological perspective, current understanding of ecosystem dynamics suggests that healthy ecosystems are those that are able to maintain their organisation and autonomy over time while remaining resilient to stress ([1] Edmonds et al 2011, [2] Raffa et al 2019).
On the other hand, the utilitarian perspective holds that a forest is healthy if management objectives are met. Consequently, a forest is unhealthy if these objectives are not met. This definition may be appropriate when there is a single, unambiguous management objective, such as timber production or the maintenance of wilderness attributes. It is, however, too narrow when multiple management objectives are required.
Finally, other forest ecologists incorporate both ecological and utilitarian perspectives into their two-part definition of forest health. First, healthy forest management should be based on its intrinsic physical properties (size, elevation, climate). This includes matching basic tree mortality to observed mortality. Secondly, a healthy forest should meet the objectives of the owner/government, provided that these objectives do not conflict with sustainability ([3] Teale and Castello 2011).
Interestingly, forest health is often defined from the “natural” perspective of the forest, or from the perspective of forest managers. We are therefore in a position to ask the questions: what are those management actions that aim to improve forest health? And why simply leave the forests untouched, which intuitively seems to be the best solution?
In 2019, the Food and Agriculture Organisation of the United Nations (FAO) is setting the guidelines for what is intended to be sustainable forest management. In view of the numerous forest fires, too devastating for ecosystems, a strategy was needed. This document, “Fire-smart forest management”, describes the methods, regulations and indicators used to perfect the remedy for poor forest health.
Among these standards are explanations of how to cut down old trees. And so a wave of tree cutting begins. A wave that could be mistaken for deforestation. Indeed, the uninformed walker is indignant to see trunks littering the ground of his favourite forest. However, here are the explanations needed to understand this measure.
One of the main causes of poor health of forest areas is an excess of trees and especially an abundance of trees of the same age. Firstly, too many trees per square metre means that there is little light. This results in few flowers and low vegetation and ultimately very little diversity. The soils under these forests are also of poor quality, lacking in bio-organisms.
We now know that the diversity and cyclicality of ecosystems often make them sustainable. The second point related to the abundance of old trees is fires. Forest fires are not bad in themselves. They have been part of the sustainability of ecosystems since long before man. However, in our case, if a fire breaks out, everything is lost. The soil is no good, nothing will grow back for a long time: the cycle is broken, sustainability is restricted.
(Unhealthy forest, What is a Healthy Forest ? , ©Jeffco Open SPace, Youtube)
Thus, these two arguments together justify cutting down thousands of old trees and planting new growth. Having a difference in the age of the trees leads to a lower risk of forest loss by fire and less fire in general. Fewer trees brings more diversity. It provides more space for animals and other forest dependents (mosses, flowers, low vegetation). All of these cascading implications result in better soil condition, and thus possible renewal, in other words: a sustainable ecosystem.
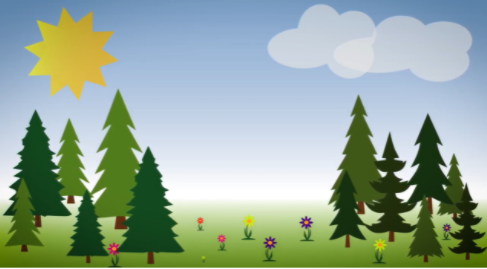
(Healthy forest, What is a Healthy Forest ? , ©Jeffco Open SPace, Youtube)
However, assessing the need for and strength of management actions in an area of interest is not an easy task. To achieve this, ecologists and forest rangers are now using computer tools. They allow to quickly visualise these areas as well as the sources of the problems.
More than ever, it is necessary for environmental decision-makers to use new computer technologies. They allow the observation, understanding and prediction of multiple changes in regions of interest. At Murmuration, as at many other environmental and IT consultancies, satellite images are the main source of this data. In Europe, the Copernicus environmental observation programme has enabled the use of such images through the launch of the Sentinel satellites. Sentinel-2, in particular, has been given the task of providing European countries with comprehensive and up-to-date data for environmental monitoring and surveillance. For the issue of forest health, three main indicators are derived from the processing of these images: NDVI, LAI and FAPAR.
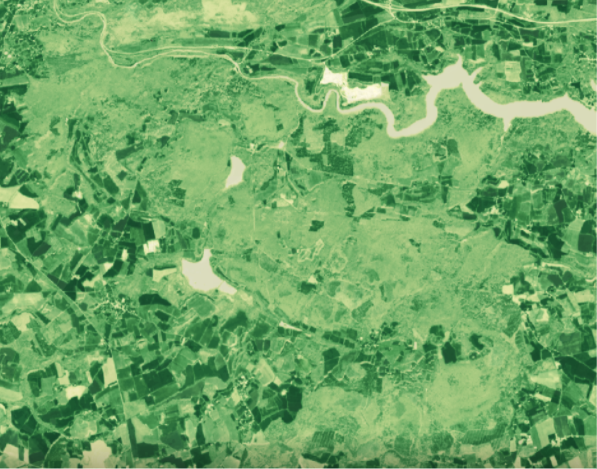
The Normalized Difference Vegetation Index (NDVI) is a simple graphical indicator. It can be used to analyse remote sensing measurements. Often based on a spatial platform, it assesses whether or not the observed target contains living green vegetation.
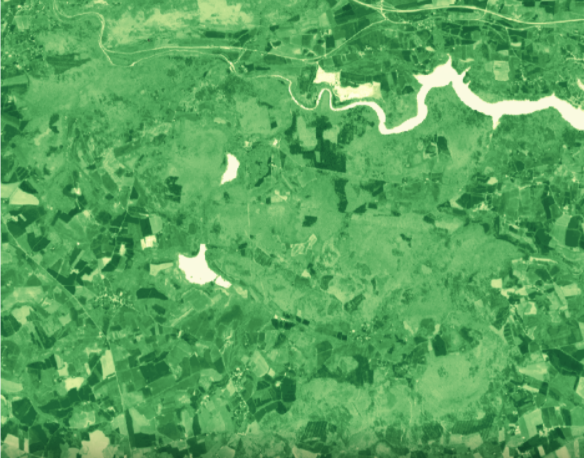
(NDVI of a forest in Bretagne, France in March 2021, 10mx10m resolution)
The Leaf Area Index (LAI) is a dimensionless quantity. It expresses the leaf area of a tree or ecosystem per unit area of soil. It is determined by calculating the total leaf area of the plant on the soil surface it covers.
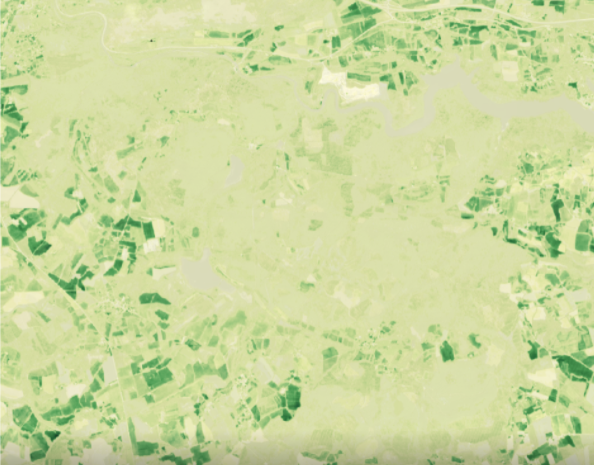
(The LAI of a forest in Bretagne, France, in March 2021 at 10mx10m resolution)
FAPAR is the fraction of solar radiation entering the spectral region of photosynthetic radiation that is absorbed by an organism. This biophysical variable is directly related to the productivity of photosynthesis. Some models use it to estimate the assimilation of carbon dioxide in vegetation. As seen previously, this carbon assimilation is very important for understanding the participation of the area under consideration in global gas exchanges.
(FAPAR of a forest in Bretagne, France, in March 2021 at 10mx10m resolution)
Thanks to these satellite images, it is possible to visualise the evolution of ecosystems. This makes it possible to conceptualise the actions to be taken. It is by considering these indicators that the management of forest areas can be done effectively.
Forests are the lungs of the Earth, they are also the terrestrial receptacles of plant and animal biodiversity. Yet there is a lack of information on their management, whether in France or elsewhere. Contrary to what one might think, leaving a forest alone is not always equivalent to helping it.
At Murmuration we use these environmental indicators to go one step further. Indeed, the jointness and correlation between these variables and other indicators, both ecological and social, allow us to highlight the impacts of humans on biodiversity and the evolution of a vegetated region. Once highlighted, these issues are intended to be the arguments for tomorrow’s decisions.
[1] – Edmonds, R.L.; Agee, J.K.; Gara, R.I. 2011. Protection et santé de la forêt.
[2] – Raffa, K.F.; Aukema, B.; Bentz, B.J. [et al]. 2009. Une utilisation littérale de la “santé des forêts” permet de se prémunir contre les abus et les mauvaises applications. Journal de pratique forestière.
[3] – Teale, S.A. ; Castello, J.D. 2011. Le passé comme clé de l’avenir : une nouvelle perspective sur la santé des forêts.
Authors : Mael Plantec, Remi Nassiri
For the first time in France, tourism and space companies are coming together to present innovations at the crossroads of these two worlds. For two days participants will explore the contribution of space to the benefit of tourism innovation through several highlights … Round Tables Big Data, spatial data, artificial intelligence … what potential for tourism?
We ‘re glad this meetings take place and we invite you to participate it. The MURMURATION SAS team will be there too!